Riviere-au-Renard (QC) Weather & Climate: Best Time to Visit
Average temperatures, rainfall, sunshine and the best time to visit Riviere-au-Renard.
Climate overview of Riviere-au-Renard
Riviere-au-Renard, Quebec, Canada, sees big temperature differences between seasons, with August peaking at 20°C (68°F) and February dropping to -6°C (21°F).
With around 1220 mm (48 in) of annual rain/snowfall, Riviere-au-Renard has a notably wet climate. However, this rain/snowfall is not evenly distributed, the city has pleasant summers and very cold winters. The wettest month is October.
Riviere-au-Renard Weather by Month
Pick a month to see the average temperature, rainfall and sunshine in Riviere-au-Renard - and find the best time to visit.

Monthly Temperature in Riviere-au-Renard
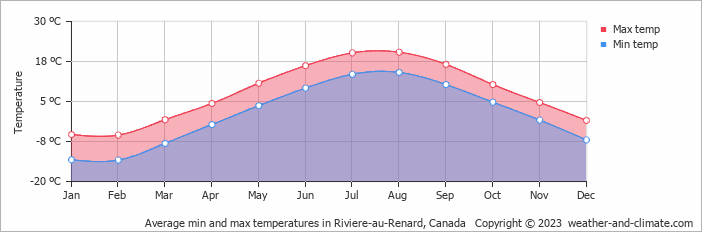
Visitors to Riviere-au-Renard can expect significant temperature changes throughout the year. Average daytime temperatures reach a pleasant 20°C (68°F) in August. In February, the coolest month of the year, temperatures drop to a very cold -6°C (21°F).
At night, temperatures range from around 14°C (57°F) in August to -13°C (9°F) in February.
Check out our detailed temperature page for more information.
Temperature ranges by month
Rainfall in Riviere-au-Renard
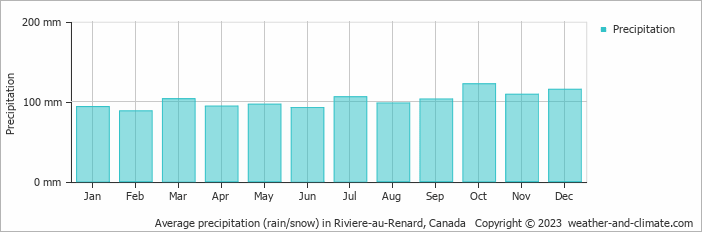
Riviere-au-Renard is known for its substantial rain/snowfall, with annual precipitation reaching 1220 mm (48 in). Despite minor fluctuations, Riviere-au-Renard enjoys fairly consistent precipitation throughout the year. In October, you can expect around 122 mm (4.8 in) of precipitation, while in February, Riviere-au-Renard receives about 88 mm (3.5 in). For more details, please visit our Riviere-au-Renard Precipitation page.
The mean monthly precipitation over the year, including rain, hail, and snow
The average number of days each month with precipitation

Best Time to Visit Riviere-au-Renard
Monthly ratings reflect general weather comfort, based on daytime temperature and rainfall. Swimming and winter conditions are highlighted separately where relevant.
- Best overall: August
- Warmest weather: July and August
- Seasonal pattern: Pleasant summers and very cold winters
- Coldest conditions: February, with freezing nights around -13°C (9°F).
Frequently asked questions about the climate in Riviere-au-Renard
What is the best time to visit Riviere-au-Renard?
August typically offers the most optimal weather in Riviere-au-Renard. In contrast, January, February, March, April, October, November and December tend to have less optimal conditions. Riviere-au-Renard has pleasant summers and very cold winters.
What temperatures can I expect in Riviere-au-Renard?
Daytime highs range from -6°C (21°F) in February to 20°C (68°F) in August. Nighttime lows range from -13°C (9°F) to 14°C (57°F). Temperatures vary considerably through the year.
How much rain does Riviere-au-Renard get?
Annual rainfall is around 1220 mm (48 in). October is the wettest month with 122 mm (4.8 in), while February is the driest with 88 mm (3.5 in).
Riviere-au-Renard 3-Day Forecast
Riviere-au-Renard on the map
Riviere-au-Renard is highlighted - select any city to see its climate.
Popular this month
Where to go in September - average daytime high across popular destinations.
 Toronto
 22°C (72°F) Niagara Falls23°C (73°F) Montréal
 22°C (72°F) Ottawa22°C (72°F) Quebec City
 20°C (68°F) Vancouver19°C (66°F) Calgary19°C (66°F) Whistler15°C (59°F)















Bucket list
Need travel inspiration? Check out our bucket list articles and be inspired.
The 5 most beautiful lakes in Canada
Explore Canada's stunning lakes: Lake Louise, Lake Superior, Maligne Lake, Emerald Lake, and Lake Okanagan, each offering unique beauty and activities.
Canoeing the south Nahannii
The South Nahanni in the northwest of Canada is one of the most impressive wilderness rivers in the world. Canoeing the south Nahanni is something you must add to your bucket list.
See Polar Bears in Churchill Canada
Thousands of bears gather at the small town of Churchill. In the evening the northern lights give a light show against the dark evening sky. An unforgettable experience.
Banff National Park
Snowy mountains, clear blue lakes and green forests make Banff National Park a wonderful bucket list destination. The pristine wilderness is a mecca for walkers.