Pizzolungo Weather & Climate: Best Time to Visit
Temperatures in Pizzolungo, Sicily, Italy, vary greatly throughout the year. August is the hottest month at 31°C (88°F), while February is the coldest at 15°C (59°F).
Annual rainfall is moderate at around 602 mm (24 in), with November being the wettest month. The city also has a distinct dry season from May to August. Sunshine peaks in July, when the city sees around 11.6 hours of sunshine per day.
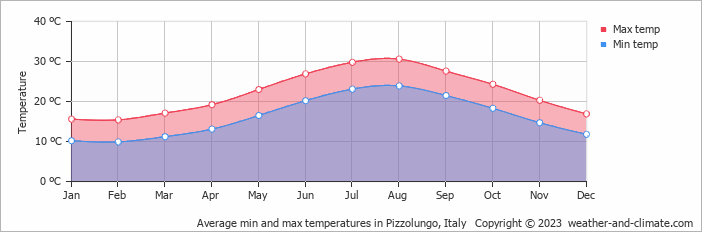
Monthly Temperature in Pizzolungo
The climate in Pizzolungo is known for significant temperature differences throughout the year, making the weather dynamic. Average daytime temperatures reach a very warm 31°C (88°F) in August. In February, the coolest month of the year, temperatures drop to a moderate 15°C (59°F).
At night, temperatures range from around 24°C (75°F) in August to 10°C (50°F) in February.
Check out our detailed temperature page for more information.
Temperature ranges by month
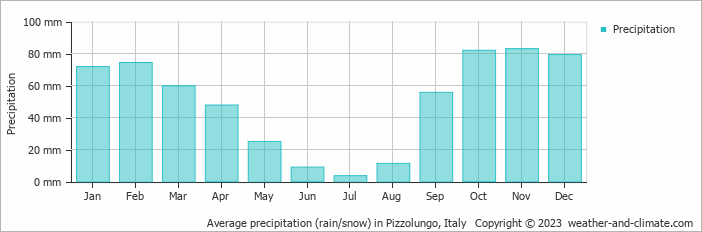
Rainfall in Pizzolungo
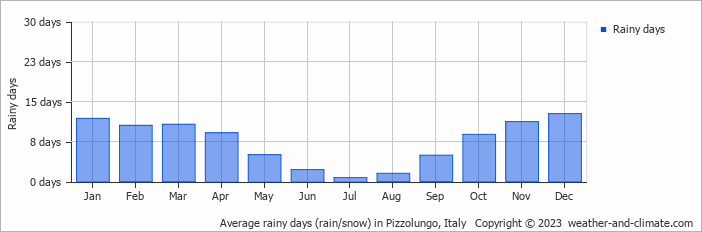
Generally, Pizzolungo receives mid-range precipitation levels, with 602 mm (24 in) annually. Pizzolungo can be quite wet during November, receiving approximately 83 mm (3.3 in) of precipitation over 11 rainy days.
In contrast, during the driest month (July), you will experience much drier conditions, with 3.5 mm (0.1 in) of precipitation spread across a single rainy day days. For more details, please visit our Pizzolungo Precipitation page.
The mean monthly precipitation over the year, including rain, hail, and snow
The average number of days each month with precipitation
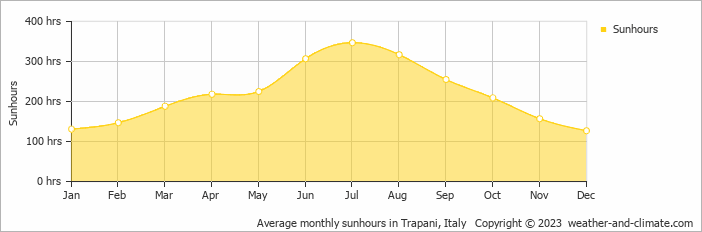
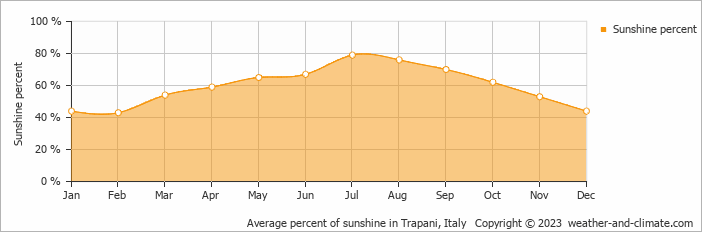
Sunshine Hours in Pizzolungo
Pizzolungo can be enjoyed more throughout the sunniest month of July under a blue sky, with approximately 11.6 hours of sunshine daily. In contrast, the city experiences much darker days in December, with only 4.2 hours of sunlight per day.
Visit our detailed sunshine hours page for more information.
Monthly hours of sunshine
Daily hours of sunshine
Daily percentage of sunshine
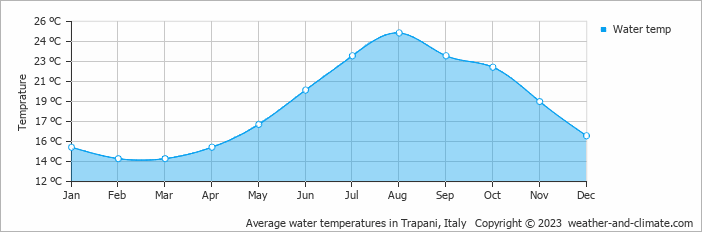
Water Temperature in Pizzolungo
The mean water temperature over the year ranges from 14°C (57°F) in February to 25°C (77°F) in August.
Water temperature over the year
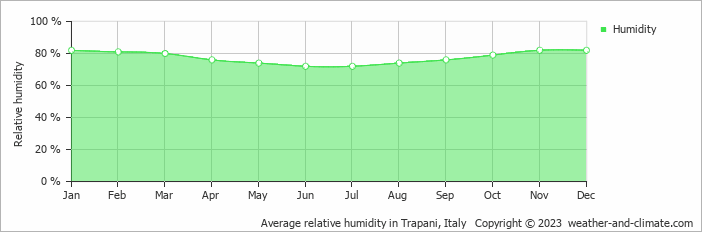
Humidity in Pizzolungo by Month
The relative humidity is high throughout the year in Pizzolungo.
The city experiences its highest humidity in January, reaching 82%. In June, the humidity drops to its lowest level at 72%. What does this mean? Read our detailed page on humidity levels for further details.
Relative humidity over the year
Pizzolungo 3-Day Forecast
Check the conditions for any month of the year.


