Pietralunga Weather & Climate: Best Time to Visit
Pietralunga, Le Marche, Italy, experiences significant temperature variation throughout the year. Summers bring daytime highs of 29°C (84°F) in August, while winters cool to 8°C (46°F) in January.
Pietralunga sees a moderate amount of rain/snowfall, totalling around 961 mm (38 in) per year. The sunniest month is July, with 9.5 hours of sunshine per day on average.
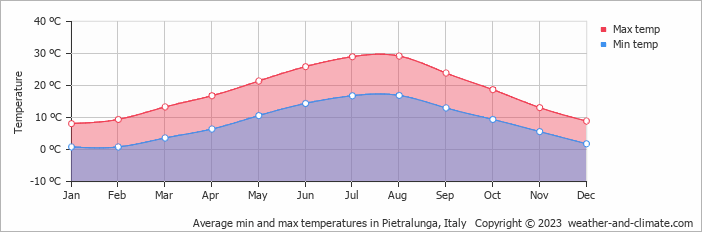
Monthly Temperature in Pietralunga
Depending on the time of the year, temperatures range from comfortable to chilly in Pietralunga. Average maximum daytime temperatures range from a comfortable 29°C (84°F) in August, the warmest time of the year, to a chilly 8°C (46°F) during cooler months like January.
At night, you can expect temperatures ranging from 17°C (63°F) in August to around 1°C (34°F) during January.
Check out our detailed temperature page for more information.
Temperature ranges by month
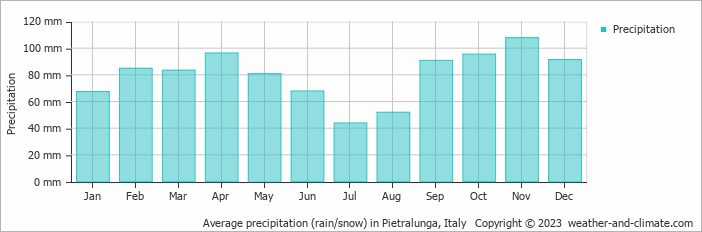
Rainfall in Pietralunga
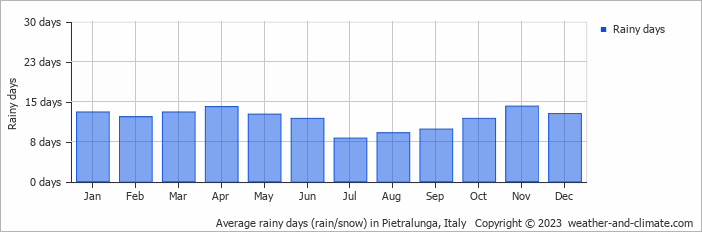
Generally, Pietralunga has a moderate amount of precipitation, averaging 961 mm (38 in) of rain/snowfall annually. Significant seasonal changes in precipitation occur throughout the year. In the wettest month, November it receives high rainfall, averaging 108 mm (4.3 in) of precipitation, recorded across 14 rainy days. In contrast, the driest month July brings less rainfall, with 44 mm (1.7 in) over 8 rainy days. For more details, please visit our Pietralunga Precipitation page.
The mean monthly precipitation over the year, including rain, hail, and snow
The average number of days each month with precipitation
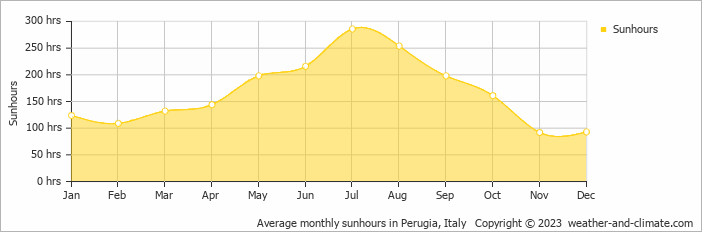
Sunshine Hours in Pietralunga
Seasonal changes in sunshine hours are quite dramatic in Pietralunga. While July receives considerable daily sunshine with up to 9.5 hours, November marks the darkest time of the year, where sunshine is scarce with only 3.1 hours of sunlight per day.
Visit our detailed sunshine hours page for more information.
Monthly hours of sunshine
Daily hours of sunshine
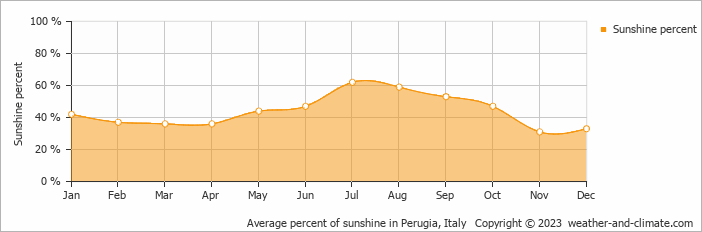
Daily percentage of sunshine
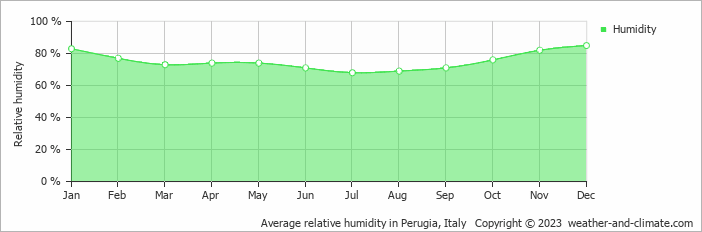
Humidity in Pietralunga by Month
The relative humidity is high throughout the year in Pietralunga.
The city experiences its highest humidity in December, reaching 85%. In July, the humidity drops to its lowest level at 68%. What does this mean? Read our detailed page on humidity levels for further details.
Relative humidity over the year
Pietralunga 3-Day Forecast
Check the conditions for any month of the year.
Best Time to Visit Pietralunga
During the months of May, June, July, August, September and October, Pietralunga enjoys pleasant weather with average temperatures ranging from 19°C (66°F) to 29°C (85°F). These months are perfect for sightseeing and exploring.Rainfall during this time ranges from 44 mm (1.7 in) in July to 95 mm (3.7 in) in October. This means you can expect a mix of sunny days and occasional showers. Need help choosing your next travel destination? We offer a specialized tool that matches you with locations based on your weather preferences. Explore destinations that suit your climate preferences.


