Murano Weather & Climate: Best Time to Visit
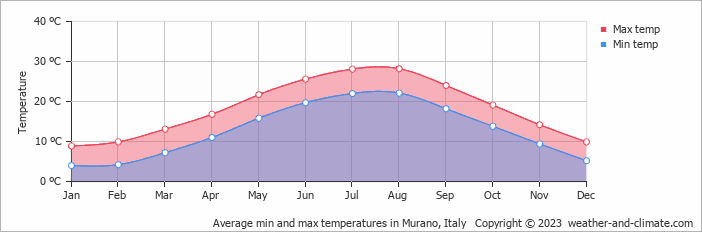
The climate in Murano, Veneto, Italy, is marked by large temperature swings across the seasons, ranging from 28°C (82°F) in August to 9°C (48°F) in January.
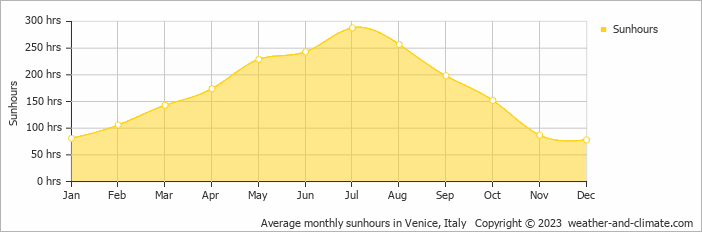
The city has a wet climate, receiving around 1113 mm (44 in) of rainfall per year. September is the wettest month. The sunniest month is July, with 9.6 hours of sunshine per day on average.
Monthly Temperature in Murano
In Murano, temperatures differ significantly between summer and winter months. On average, daytime temperatures range from a comfortable 28°C (82°F) in August to a chilly 9°C (48°F) in January.
Nighttime temperatures range from 22°C (72°F) in August to 4°C (39°F) in January.
Check out our detailed temperature page for more information.
Temperature ranges by month
Rainfall in Murano
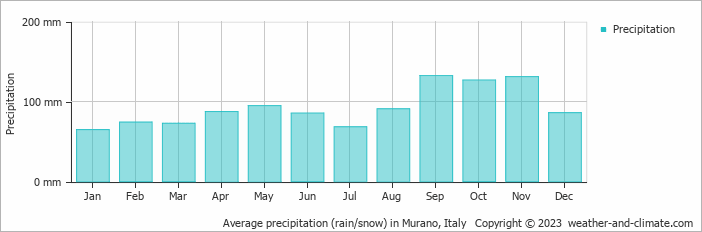
Murano experiences significant rainfall throughout the year, averaging 1113 mm (44 in) of precipitation annually. The amount of precipitation varies moderately throughout the year. The wettest month, September, sees around 132 mm (5.2 in) of rainfall, perfect for those who enjoy a bit of rain now and then. The driest month, January, still receives a respectable 65 mm (2.6 in) of rainfall. For more details, please visit our Murano Precipitation page.
The mean monthly precipitation over the year, including rain, hail, and snow
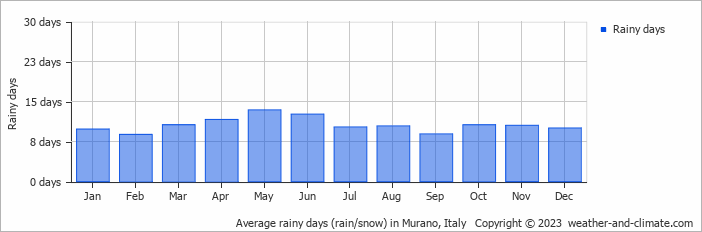
The average number of days each month with precipitation
Sunshine Hours in Murano
In Murano, summer days are longer and more sunny, with daily sunshine hours peaking at 9.6 hours in July. As the darker season arrives, the brightness of the sun becomes less. December sees a soft sun for only 2.6 hours per average day.
Visit our detailed sunshine hours page for more information.
Monthly hours of sunshine
Daily hours of sunshine
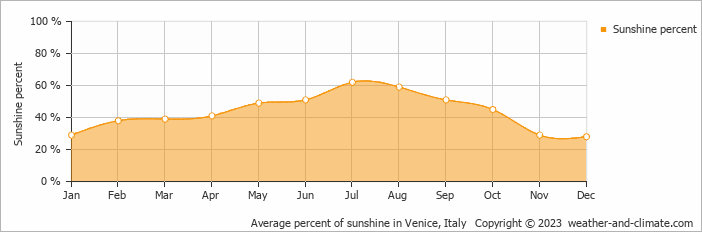
Daily percentage of sunshine
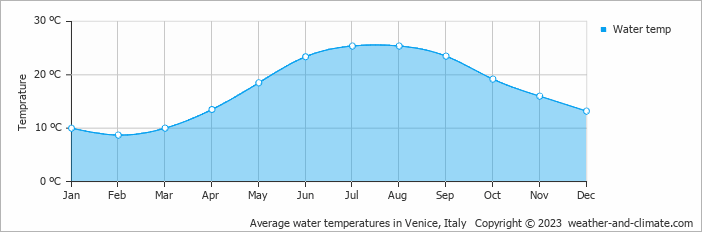
Water Temperature in Murano
The mean water temperature over the year ranges from 9°C (48°F) in February to 25°C (77°F) in July.
Water temperature over the year
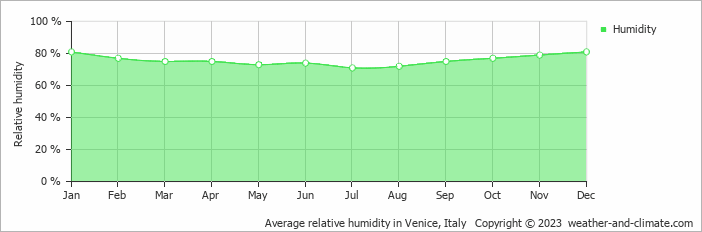
Humidity in Murano by Month
The relative humidity is high throughout the year in Murano.
The city experiences its highest humidity in January, reaching 81%. In July, the humidity drops to its lowest level at 71%. What does this mean? Read our detailed page on humidity levels for further details.
Relative humidity over the year
Murano 3-Day Forecast
Check the conditions for any month of the year.


