Monteciccardo Weather & Climate: Best Time to Visit
The climate in Monteciccardo, Le Marche, Italy, is marked by large temperature swings across the seasons, ranging from 29°C (84°F) in July to 10°C (50°F) in February.
Annual rainfall is moderate at around 840 mm (33 in), with November being the wettest month. The sunniest month is July, with 9.9 hours of sunshine per day on average.
Monthly Temperature in Monteciccardo
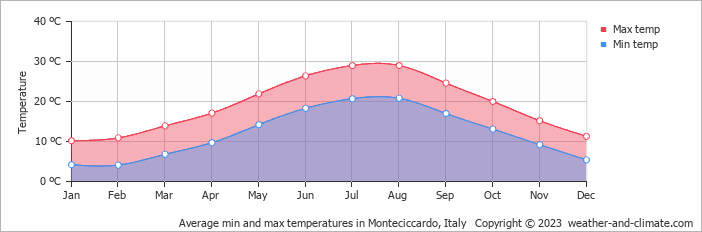
In Monteciccardo, temperatures differ significantly between summer and winter months. Average daytime temperatures reach a comfortable 29°C (84°F) in July. In February, the coolest month of the year, temperatures drop to a chilly 10°C (50°F).
At night, temperatures range from around 21°C (70°F) in July to 4°C (39°F) in February.Check out our detailed temperature page for more information.
Temperature ranges by month
Rainfall in Monteciccardo
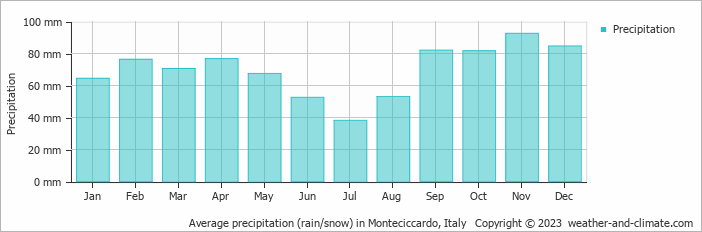
On average, Monteciccardo receives a reasonable amount of rainfall, with an annual precipitation of 840 mm (33 in). Monteciccardo can be quite wet during November, receiving approximately 93 mm (3.7 in) of precipitation over 13 rainy days.
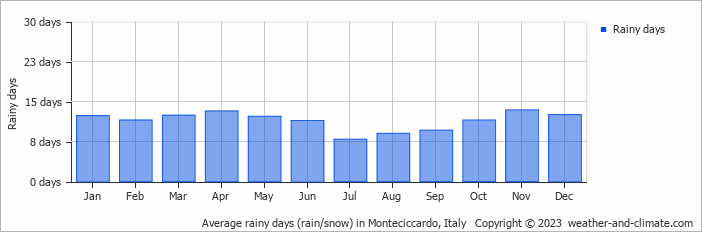
In contrast, during the driest month (July), you will experience much drier conditions, with 38 mm (1.5 in) of precipitation spread across 8 rainy days days. For more details, please visit our Monteciccardo Precipitation page.The mean monthly precipitation over the year, including rain, hail, and snow
The average number of days each month with precipitation
Sunshine Hours in Monteciccardo
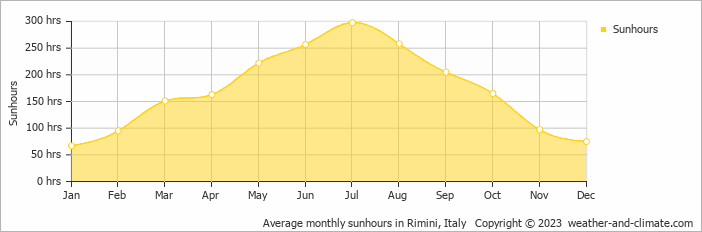
Monteciccardo can be enjoyed more throughout the sunniest month of July under a blue sky, with approximately 9.9 hours of sunshine daily. In contrast, the city experiences much darker days in January, with only 2.2 hours of sunlight per day.
Visit our detailed sunshine hours page for more information.
Monthly hours of sunshine
Daily hours of sunshine
Daily percentage of sunshine
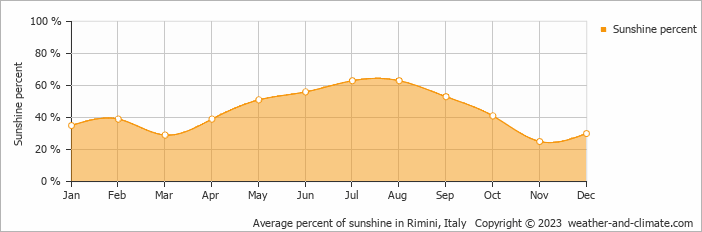
Humidity in Monteciccardo by Month
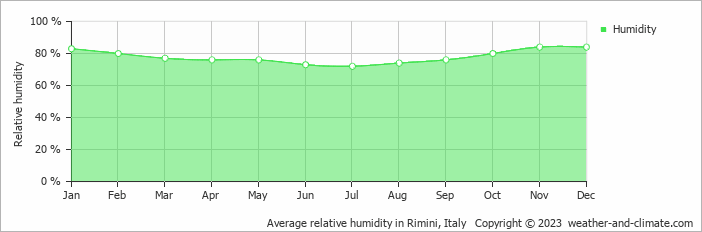
The relative humidity is high throughout the year in Monteciccardo.
The city experiences its highest humidity in November, reaching 84%. In July, the humidity drops to its lowest level at 72%. What does this mean? Read our detailed page on humidity levels for further details.
Relative humidity over the year
Monteciccardo 3-Day Forecast
Check the conditions for any month of the year.


