Marausa Weather & Climate: Best Time to Visit
Marausa, Sicily, Italy, experiences significant temperature variation throughout the year. Summers bring daytime highs of 31°C (88°F) in August, while winters cool to 15°C (59°F) in February.
Annual rainfall is moderate at around 594 mm (23 in), with November being the wettest month. The city also has a distinct dry season from May to August. The sunniest month is July, with 11.6 hours of sunshine per day on average.
Monthly Temperature in Marausa
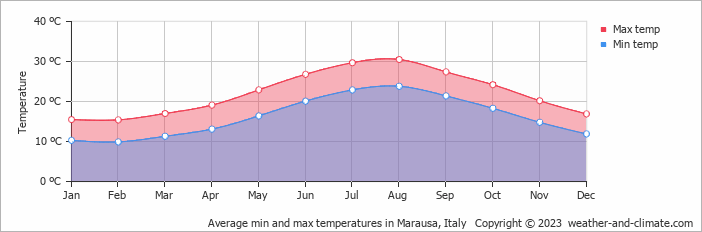
Depending on the time of the year, temperatures range from very warm to moderate in Marausa. Average daytime temperatures reach a very warm 31°C (88°F) in August. In February, the coolest month of the year, temperatures drop to a moderate 15°C (59°F).
At night, temperatures range from around 24°C (75°F) in August to 10°C (50°F) in February.Check out our detailed temperature page for more information.
Temperature ranges by month
Rainfall in Marausa
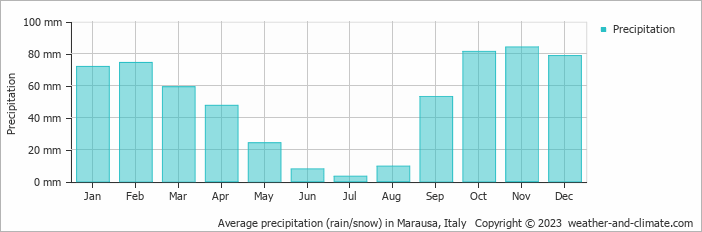
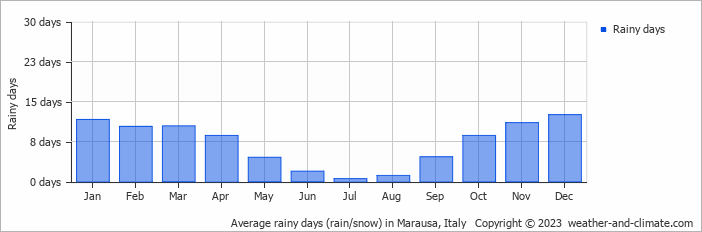
Generally, Marausa has a moderate amount of precipitation, averaging 594 mm (23 in) of rainfall annually. Marausa can be quite wet during November, receiving approximately 84 mm (3.3 in) of precipitation over 11 rainy days.
In contrast, during the driest month (July), you will experience much drier conditions, with 3.2 mm (0.1 in) of precipitation spread across a single rainy day days. For more details, please visit our Marausa Precipitation page.The mean monthly precipitation over the year, including rain, hail, and snow
The average number of days each month with precipitation
Sunshine Hours in Marausa
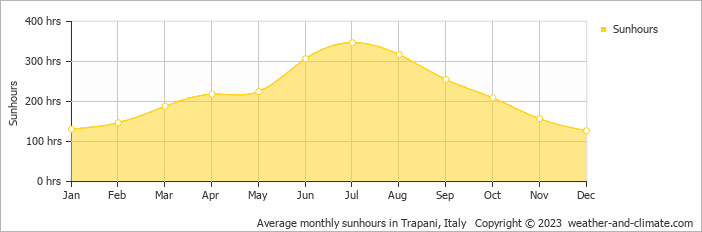
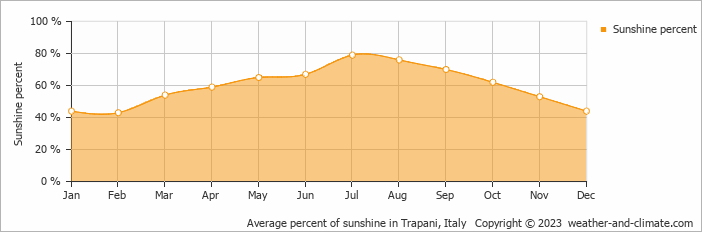
Marausa can be enjoyed more throughout the sunniest month of July under a blue sky, with approximately 11.6 hours of sunshine daily. In contrast, the city experiences much darker days in December, with only 4.2 hours of sunlight per day.
Visit our detailed sunshine hours page for more information.
Monthly hours of sunshine
Daily hours of sunshine
Daily percentage of sunshine
Water Temperature in Marausa
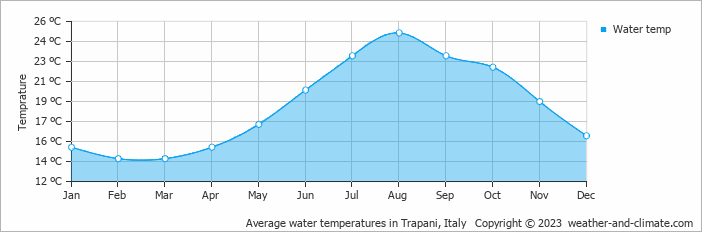
The mean water temperature over the year ranges from 14°C (57°F) in February to 25°C (77°F) in August.
Water temperature over the year
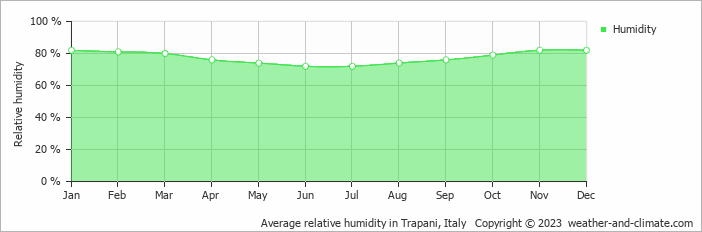
Humidity in Marausa by Month
The relative humidity is high throughout the year in Marausa.
The city experiences its highest humidity in January, reaching 82%. In June, the humidity drops to its lowest level at 72%. What does this mean? Read our detailed page on humidity levels for further details.
Relative humidity over the year
Marausa 3-Day Forecast
Check the conditions for any month of the year.
Best Time to Visit Marausa
During the months of April, May, June, July, September, October and November, Marausa enjoys pleasant weather with average temperatures ranging from 19°C (66°F) to 30°C (85°F). These months are perfect for sightseeing and exploring.Rainfall during this time ranges from 3 mm (0.1 in) in July to 84 mm (3.3 in) in November. This means you can expect a mix of sunny days and occasional showers. Wondering where to travel based on your weather preferences? Our recommendation tool helps you find destinations with your ideal climate conditions. Use our weather planner to find your perfect destination.


