Mandrica Weather & Climate: Best Time to Visit
Average temperatures, rainfall, sunshine and the best time to visit Mandrica.
Climate overview of Mandrica
The climate in Mandrica, Bulgaria, is marked by large temperature swings across the seasons, ranging from 32°C (90°F) in August to 8°C (46°F) in January.
With around 781 mm (31 in) of annual rain/snowfall, the city has moderate precipitation levels. December is the wettest month and August the driest. It also has a distinct dry season from July to August. Sunshine peaks in July, when the city sees around 9.6 hours of sunshine per day.
Mandrica Weather by Month
Pick a month to see the average temperature, rainfall and sunshine in Mandrica — and find the best time to visit.
Monthly Temperature in Mandrica
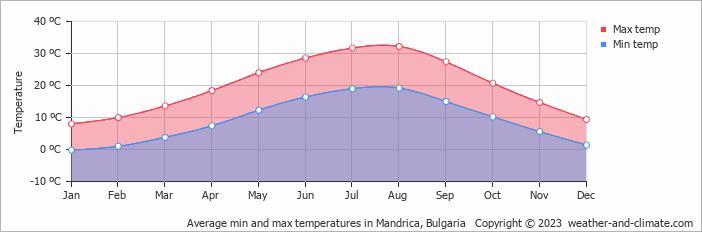
In Mandrica, temperatures differ significantly between summer and winter months. Typically, average maximum daytime temperatures range from a very warm 32°C (90°F) in August to a chilly 8°C (46°F) in the coolest month, January.
Nights vary from 19°C (66°F) in August to around 0°C (32°F) during the colder months.
Check out our detailed temperature page for more information.
Temperature ranges by month
Rainfall in Mandrica
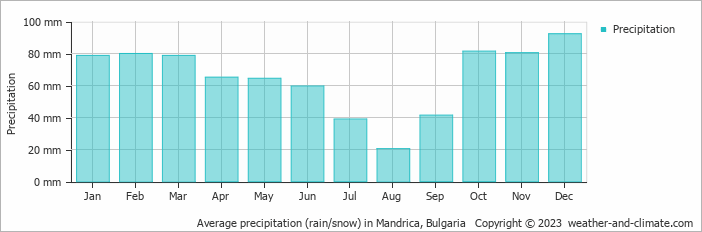
On average, Mandrica receives a reasonable amount of rain/snowfall, with an annual precipitation of 781 mm (31 in). The climate in Mandrica shows significant variation throughout the year. Expect moderate rainfall in December, the wettest month, with an average of 92 mm (3.6 in) of precipitation over 12 rainy days.
In contrast, the driest month August offers drier and sunnier days, with around 21 mm (0.8 in) of rainfall over 5 rainy days. For more details, please visit our Mandrica Precipitation page.
The mean monthly precipitation over the year, including rain, hail, and snow
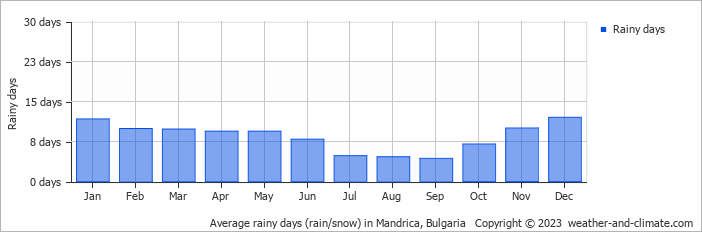
The average number of days each month with precipitation
Sunshine Hours in Mandrica
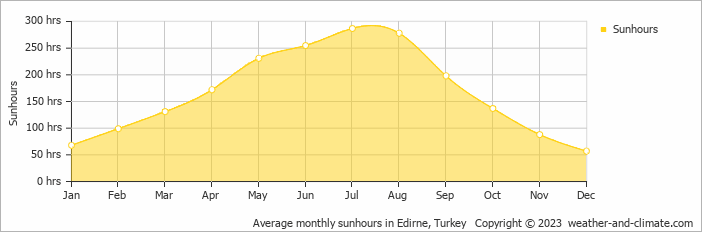
For those who appreciate different seasons, Mandrica serves as an ideal destination. Expect longer, more sun-filled days in July with an average of 9.6 hours of sunshine daily, and embrace the darker days in December, offering only 1.9 hours of daily sunlight.
Visit our detailed sunshine hours page for more information.
Monthly hours of sunshine
Daily hours of sunshine
Best Time to Visit Mandrica
Frequently asked questions about the climate in Mandrica
What is the best time to visit Mandrica?
May, June, September and October typically offer the most optimal weather in Mandrica. In contrast, January, February and December tend to have less optimal conditions. Mandrica has a distinct dry season from July to August.
What temperatures can I expect in Mandrica?
Daytime highs range from 8°C (46°F) in January to 32°C (90°F) in August. Nighttime lows range from 0°C (32°F) to 19°C (66°F). Temperatures vary considerably through the year.
How much rain does Mandrica get?
Annual rainfall is around 781 mm (31 in). December is the wettest month with 92 mm (3.6 in), while August is the driest with 21 mm (0.8 in).
How sunny is Mandrica?
Mandrica receives around 2,001 hours of sunshine per year. July is the sunniest month with 287 hours, while December is the cloudiest with just 57 hours. Overall, Mandrica enjoys abundant sunshine.
Mandrica 3-Day Forecast
Mandrica 3-Day Forecast
Mandrica on the map
Mandrica is highlighted — select any city to see its climate.
Popular this month
Where to go in July — average daytime high across popular destinations.
Bucket list
Need travel inspiration? Check out our bucket list articles and be inspired.
 7 of the most budget-friendly destinations in Europe
Discover Europe's top budget-friendly destinations including Budapest, Kotor, Krakow, and more, perfect for affordable and exciting travel.
 Meadows in the mountains
Meadows in the mountains is a world away from large line-ups and huge crowds. High in the Rhodope Mountains in Bulgaria.
 Cycle the Danube trail
The Danube cycle route is one of the most popular cycling routes in Europe, and rightly so, because it is a varied route that is interesting both in terms of culture and nature.