Loro Piceno Weather & Climate: Best Time to Visit
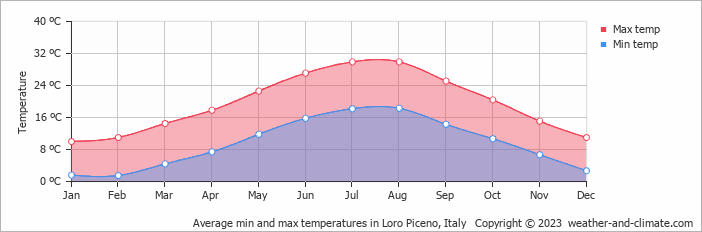
Loro Piceno, Le Marche, Italy, sees big temperature differences between seasons, with July peaking at 30°C (86°F) and February dropping to 10°C (50°F).
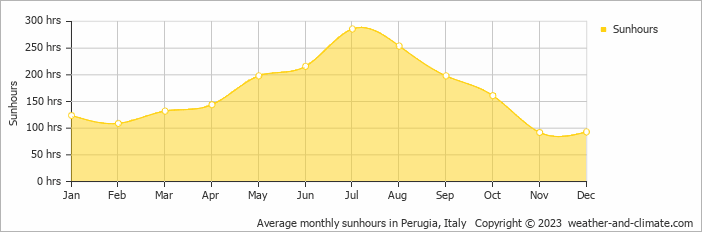
Annual rain/snowfall is moderate at around 913 mm (36 in), with April being the wettest month. July is the sunniest month, averaging 9.5 hours of sunshine per day.
Monthly Temperature in Loro Piceno
Visitors to Loro Piceno can expect significant temperature changes throughout the year. Average daytime temperatures reach a comfortable 30°C (86°F) in July. In February, the coolest month of the year, temperatures drop to a chilly 10°C (50°F).
At night, temperatures range from around 18°C (64°F) in July to 2°C (36°F) in February.Check out our detailed temperature page for more information.
Temperature ranges by month
Rainfall in Loro Piceno
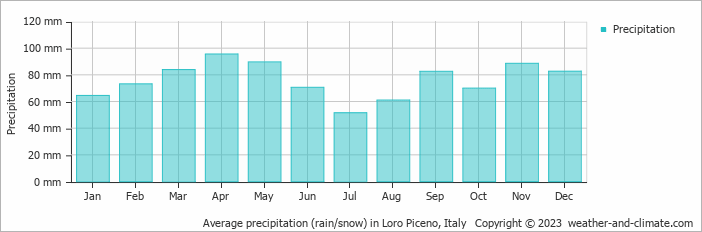
Generally, Loro Piceno experiences moderate precipitation patterns, averaging 913 mm (36 in) yearly. Loro Piceno experiences moderate seasonal variation in rainfall, with monthly averages ranging from 96 mm (3.8 in) in April, the wettest month, and 51 mm (2 in) in July, the driest month. For more details, please visit our Loro Piceno Precipitation page.
The mean monthly precipitation over the year, including rain, hail, and snow
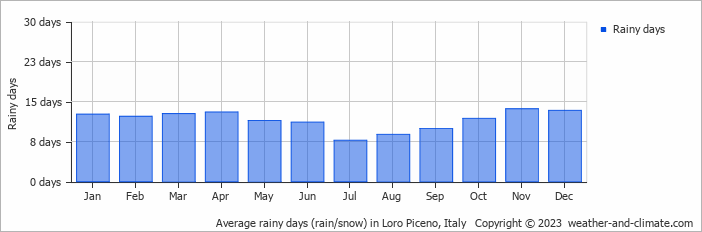
The average number of days each month with precipitation
Sunshine Hours in Loro Piceno
Loro Piceno can be enjoyed more throughout the sunniest month of July under a blue sky, with approximately 9.5 hours of sunshine daily. In contrast, the city experiences much darker days in November, with only 3.1 hours of sunlight per day.
Visit our detailed sunshine hours page for more information.
Monthly hours of sunshine
Daily hours of sunshine
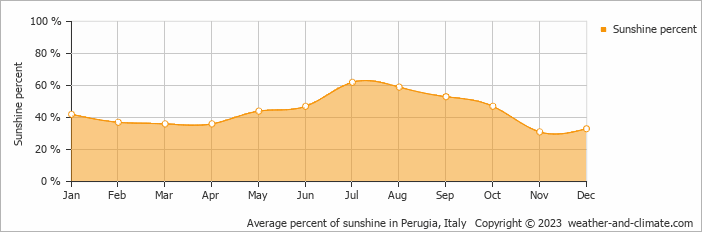
Daily percentage of sunshine
Humidity in Loro Piceno by Month
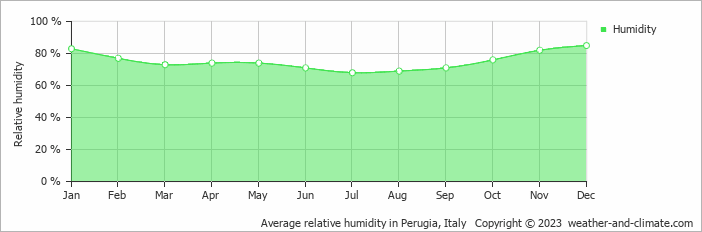
The relative humidity is high throughout the year in Loro Piceno.
The city experiences its highest humidity in December, reaching 85%. In July, the humidity drops to its lowest level at 68%. What does this mean? Read our detailed page on humidity levels for further details.
Relative humidity over the year
Loro Piceno 3-Day Forecast
Check the conditions for any month of the year.
Best Time to Visit Loro Piceno
During May, June, July, August, September and October, Loro Piceno experiences its most favorable weather, with temperatures between 20°C (69°F) and 30°C (86°F). These mild conditions make it an excellent time for a visit.The weather does bring rainfall during this period, between 51 mm (2 in) and 90 mm (3.5 in). Wondering where to travel based on your weather preferences? Our recommendation tool helps you find destinations with your ideal climate conditions. Use our weather planner to find your perfect destination.


