La Martre (QC) Weather & Climate: Best Time to Visit
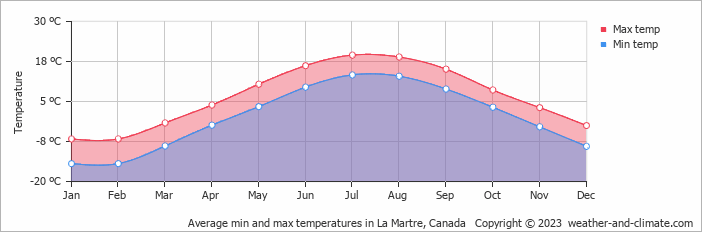
La Martre, Quebec, Canada, sees big temperature differences between seasons, with July peaking at 20°C (68°F) and January dropping to -7°C (19°F).
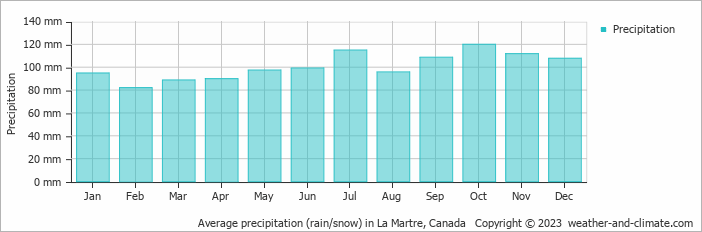
The city has a wet climate, receiving around 1210 mm (48 in) of rain/snowfall per year. October is the wettest month.
Monthly Temperature in La Martre
Visitors to La Martre can expect significant temperature changes throughout the year. On average, daytime temperatures range from a pleasant 20°C (68°F) in July to a very cold -7°C (19°F) in January.
Nighttime temperatures range from 13°C (55°F) in July to -14°C (7°F) in January.Check out our detailed temperature page for more information.
Temperature ranges by month
Rainfall in La Martre
La Martre is known for its substantial rain/snowfall, with annual precipitation reaching 1210 mm (48 in). The wettest period in La Martre occurs in October, which receives around 120 mm (4.7 in) of precipitation. During the driest month, February, La Martre experiences moderate snowfall, totaling 82 mm (3.2 in). The consistent precipitation levels throughout the year contribute to a relatively stable climate. For more details, please visit our La Martre Precipitation page.
The mean monthly precipitation over the year, including rain, hail, and snow
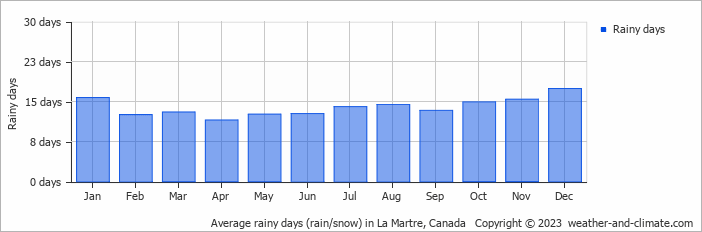
The average number of days each month with precipitation
La Martre (QC) 3-Day Forecast
Check the conditions for any month of the year.
Best Time to Visit La Martre
During June, July and August, La Martre experiences its most favorable weather, with temperatures between 16°C (61°F) and 20°C (67°F). These mild conditions make it an excellent time for a visit.The weather does bring rainfall during this period, between 96 mm (3.8 in) and 115 mm (4.5 in). Seeking the perfect travel destination for this year? We've created a tool that suggests locations matching your desired weather. Let our weather planner guide your travel decisions.


