Jurilovca Weather & Climate: Best Time to Visit
Average temperatures, rainfall, sunshine and the best time to visit Jurilovca.
Climate overview of Jurilovca
Jurilovca, Tulcea, Romania, sees big temperature differences between seasons, with July peaking at 29°C (84°F) and January dropping to 5°C (41°F).
Annual rain/snowfall is moderate at around 517 mm (20 in), with June being the wettest month. The city also has a distinct dry season from July to August. July is the sunniest month, averaging 10.9 hours of sunshine per day.
Jurilovca Weather by Month
Pick a month to see the average temperature, rainfall and sunshine in Jurilovca — and find the best time to visit.
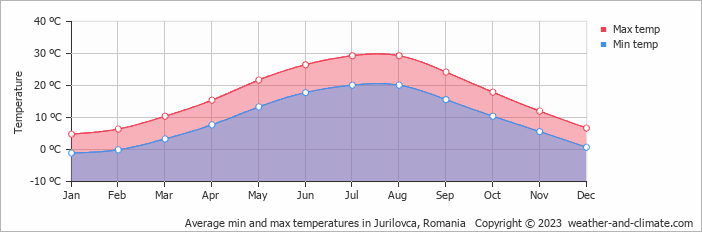
Monthly Temperature in Jurilovca
Visitors to Jurilovca can expect significant temperature changes throughout the year. Average daytime temperatures reach a comfortable 29°C (84°F) in July. In January, the coolest month of the year, temperatures drop to a chilly 5°C (41°F).
At night, temperatures range from around 20°C (68°F) in July to -1°C (30°F) in January.
Check out our detailed temperature page for more information.
Temperature ranges by month
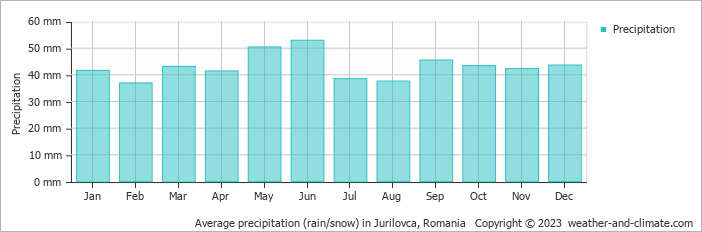
Rainfall in Jurilovca
Generally, Jurilovca experiences moderate precipitation patterns, averaging 517 mm (20 in) yearly. Despite minor fluctuations, Jurilovca enjoys fairly consistent precipitation throughout the year. In June, you can expect around 53 mm (2.1 in) of precipitation, while in February, Jurilovca receives about 37 mm (1.5 in). For more details, please visit our Jurilovca Precipitation page.
The mean monthly precipitation over the year, including rain, hail, and snow
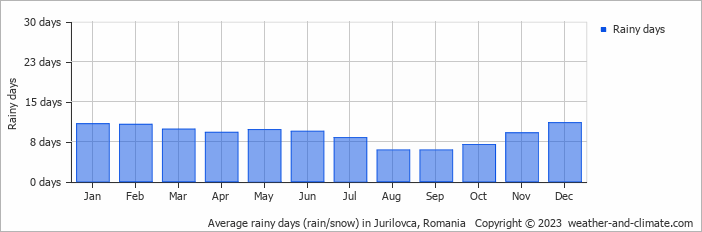
The average number of days each month with precipitation
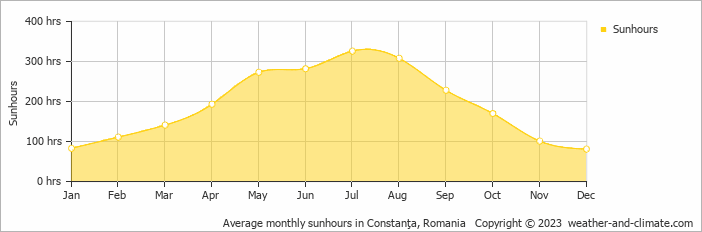
Sunshine Hours in Jurilovca
Jurilovca can be enjoyed more throughout the sunniest month of July under a blue sky, with approximately 10.9 hours of sunshine daily. In contrast, the city experiences much darker days in December, with only 2.7 hours of sunlight per day.
Visit our detailed sunshine hours page for more information.
Monthly hours of sunshine
Daily hours of sunshine
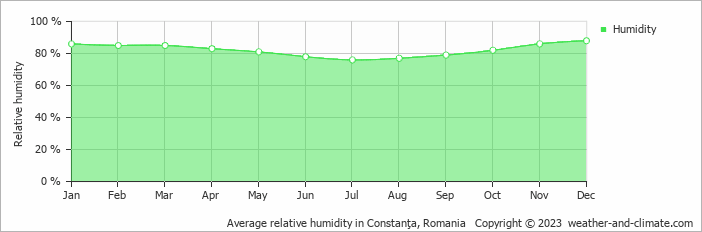
Humidity in Jurilovca by Month
The city experiences its highest humidity in December, reaching 88%. In July, the humidity drops to its lowest level at 76%. What does this mean? Read our detailed page on humidity levels for further details.
Relative humidity over the year
Best Time to Visit Jurilovca
The weather does bring rainfall during this period, between 38 mm (1.5 in) and 53 mm (2.1 in). Planning your next adventure but unsure where to go? Our climate tool suggests perfect locations tailored to your preferred weather conditions. Discover your ideal travel destination with our weather planner.
Frequently asked questions about the climate in Jurilovca
What is the best time to visit Jurilovca?
May, June, July, August and September typically offer the most optimal weather in Jurilovca. In contrast, January, February, March and December tend to have less optimal conditions. Jurilovca has a distinct dry season from July to August.
What temperatures can I expect in Jurilovca?
Daytime highs range from 5°C (41°F) in January to 29°C (84°F) in July. Nighttime lows range from -1°C (30°F) to 20°C (68°F). Temperatures vary considerably through the year.
How much rain does Jurilovca get?
Annual rainfall is around 517 mm (20 in). June is the wettest month with 53 mm (2.1 in), while February is the driest with 37 mm (1.5 in).
How sunny is Jurilovca?
Jurilovca receives around 2,297 hours of sunshine per year. July is the sunniest month with 326 hours, while December is the cloudiest with just 81 hours. Overall, Jurilovca enjoys abundant sunshine.
Jurilovca 3-Day Forecast
Jurilovca 3-Day Forecast
Jurilovca on the map
Jurilovca is highlighted — select any city to see its climate.
Popular this month
Where to go in July — average daytime high across popular destinations.
Bucket list
Need travel inspiration? Check out our bucket list articles and be inspired.
 The train journey from Bucharest to Brasov is one of the most beautiful in Romania
In three hours, you'll get from Bucharest to Brasov by train. It is one of the most beautiful routes in Romania, certainly the most beautiful that can be done by express train.
 7 of the most budget-friendly destinations in Europe
Discover Europe's top budget-friendly destinations including Budapest, Kotor, Krakow, and more, perfect for affordable and exciting travel.
 Cycle the Danube trail
The Danube cycle route is one of the most popular cycling routes in Europe, and rightly so, because it is a varied route that is interesting both in terms of culture and nature.