Indian Brook (NS) Weather & Climate: Best Time to Visit
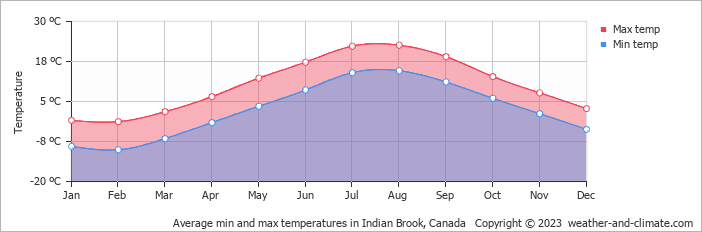
Temperatures in Indian Brook, Nova Scotia, Canada, vary greatly throughout the year. August is the hottest month at 23°C (73°F), while February is the coldest at -1°C (30°F).
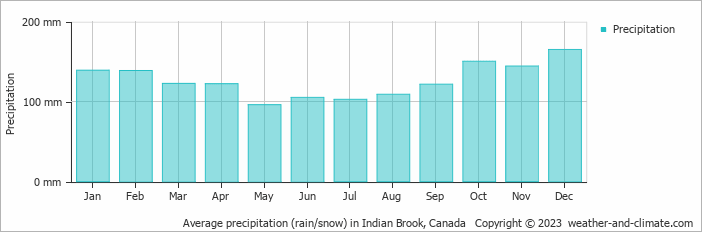
The city has a wet climate, receiving around 1514 mm (60 in) of rain/snowfall per year. December is the wettest month.
Monthly Temperature in Indian Brook
The climate in Indian Brook is known for significant temperature differences throughout the year, making the weather dynamic. On average, daytime temperatures range from a comfortable 23°C (73°F) in August to a very cold -1°C (30°F) in February.
Nighttime temperatures range from 15°C (59°F) in August to -10°C (14°F) in February.Check out our detailed temperature page for more information.
Temperature ranges by month
Rainfall in Indian Brook
Indian Brook has a notably wet climate with abundant precipitation, recording 1514 mm (60 in) of rain/snowfall per year. The amount of precipitation varies moderately throughout the year. The wettest month, December, sees around 165 mm (6.5 in) of snow/rainfall, perfect for those who enjoy a bit of snow/rain now and then. The driest month, May, still receives a respectable 96 mm (3.8 in) of rainfall. For more details, please visit our Indian Brook Precipitation page.
The mean monthly precipitation over the year, including rain, hail, and snow
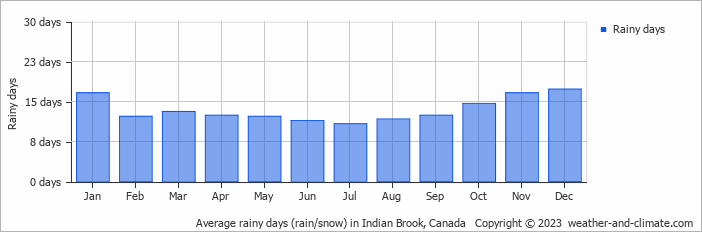
The average number of days each month with precipitation
Indian Brook (NS) 3-Day Forecast
Check the conditions for any month of the year.
Best Time to Visit Indian Brook
Indian Brook's weather is most enjoyable during July, August and September, with comfortable temperatures from 19°C (66°F) to 23°C (73°F). The moderate conditions ensure pleasant weather for exploring the area. Expect varied weather during this period with rainfall between 103 mm (4.1 in) and 121 mm (4.8 in), providing a good balance of sunny and rainy days.The wettest months are December, when precipitation is at its highest. Need help choosing your next travel destination? We offer a specialized tool that matches you with locations based on your weather preferences. Explore destinations that suit your climate preferences.


