Guarrato Weather & Climate: Best Time to Visit
The climate in Guarrato, Sicily, Italy, is marked by large temperature swings across the seasons, ranging from 31°C (88°F) in August to 15°C (59°F) in February.
Guarrato sees a moderate amount of rainfall, totalling around 592 mm (23 in) per year. It experiences a distinct dry season from May to August, creating some seasonal variation. July is the sunniest month, averaging 11.6 hours of sunshine per day.
Monthly Temperature in Guarrato
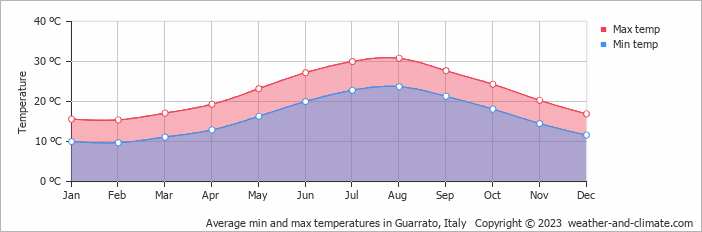
In Guarrato, temperatures differ significantly between summer and winter months. Average maximum daytime temperatures range from a very warm 31°C (88°F) in August, the warmest time of the year, to a moderate 15°C (59°F) during cooler months like February.
At night, you can expect temperatures ranging from 24°C (75°F) in August to around 10°C (50°F) during February.
Check out our detailed temperature page for more information.
Temperature ranges by month
Rainfall in Guarrato
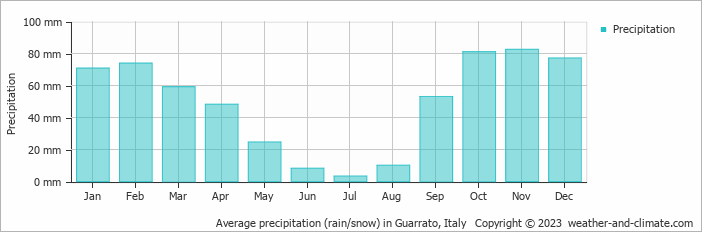
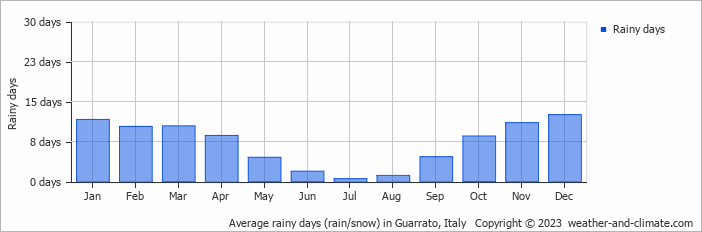
On average, Guarrato receives a reasonable amount of rainfall, with an annual precipitation of 592 mm (23 in). Significant seasonal changes in precipitation occur throughout the year. In the wettest month, November it receives moderate rainfall, averaging 83 mm (3.3 in) of precipitation, recorded across 11 rainy days. In contrast, the driest month July brings less rainfall, with 3.3 mm (0.1 in) over a single rainy day. For more details, please visit our Guarrato Precipitation page.
The mean monthly precipitation over the year, including rain, hail, and snow
The average number of days each month with precipitation
Sunshine Hours in Guarrato
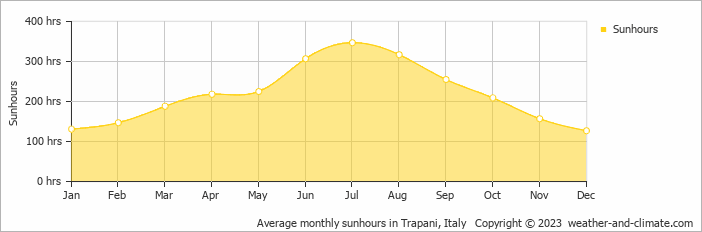
Seasonal changes in sunshine hours are quite dramatic in Guarrato. While July receives considerable daily sunshine with up to 11.6 hours, December marks the darkest time of the year, where sunshine is scarce with only 4.2 hours of sunlight per day.
Visit our detailed sunshine hours page for more information.
Monthly hours of sunshine
Daily hours of sunshine
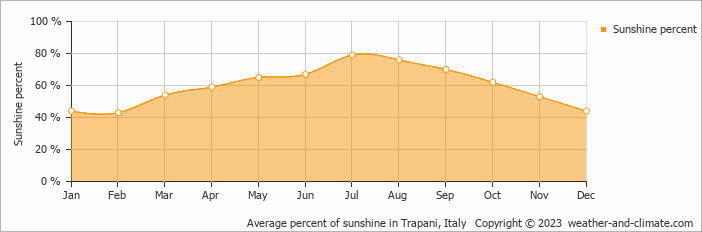
Daily percentage of sunshine
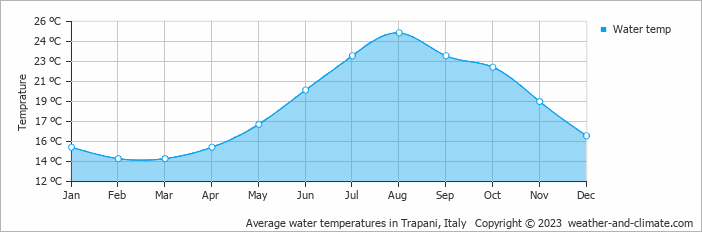
Water Temperature in Guarrato
The mean water temperature over the year ranges from 14°C (57°F) in February to 25°C (77°F) in August.
Water temperature over the year
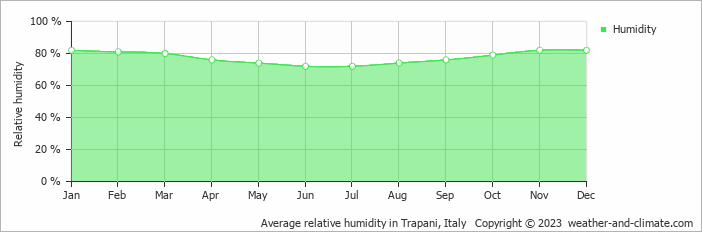
Humidity in Guarrato by Month
The relative humidity is high throughout the year in Guarrato.
The city experiences its highest humidity in January, reaching 82%. In June, the humidity drops to its lowest level at 72%. What does this mean? Read our detailed page on humidity levels for further details.
Relative humidity over the year
Guarrato 3-Day Forecast
Check the conditions for any month of the year.


