Graffignano Weather & Climate: Best Time to Visit
The climate in Graffignano, Italy, is marked by large temperature swings across the seasons, ranging from 32°C (90°F) in August to 11°C (52°F) in January.
With around 995 mm (39 in) of annual rain/snowfall, the city has moderate precipitation levels. November is the wettest month and July the driest. Sunshine peaks in July, when the city sees around 9.5 hours of sunshine per day.
Monthly Temperature in Graffignano
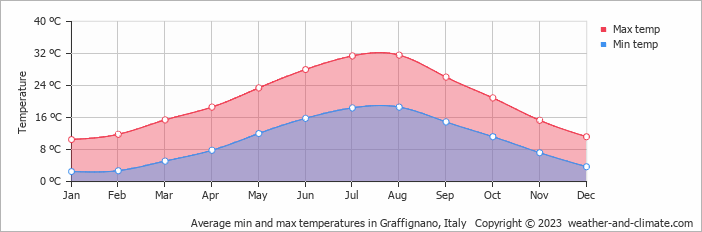
In Graffignano, temperatures differ significantly between summer and winter months. Typically, average maximum daytime temperatures range from a very warm 32°C (90°F) in August to a chilly 11°C (52°F) in the coolest month, January.
Nights vary from 19°C (66°F) in August to around 3°C (37°F) during the colder months.
Check out our detailed temperature page for more information.
Temperature ranges by month
Rainfall in Graffignano
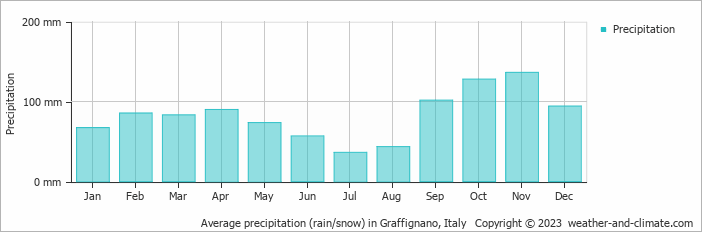
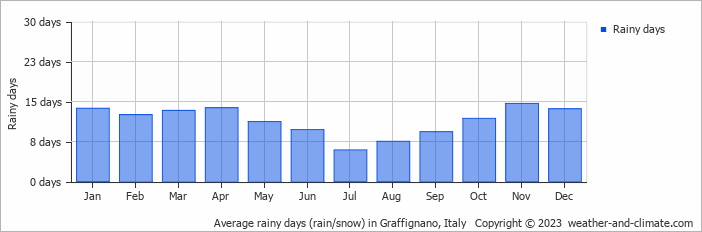
On average, Graffignano receives a reasonable amount of rain/snowfall, with an annual precipitation of 995 mm (39 in). The climate in Graffignano shows significant variation throughout the year. Expect high rainfall in November, the wettest month, with an average of 136 mm (5.4 in) of precipitation over 15 rainy days.
In contrast, the driest month July offers drier and sunnier days, with around 36 mm (1.4 in) of rainfall over 6 rainy days. For more details, please visit our Graffignano Precipitation page.
The mean monthly precipitation over the year, including rain, hail, and snow
The average number of days each month with precipitation
Sunshine Hours in Graffignano
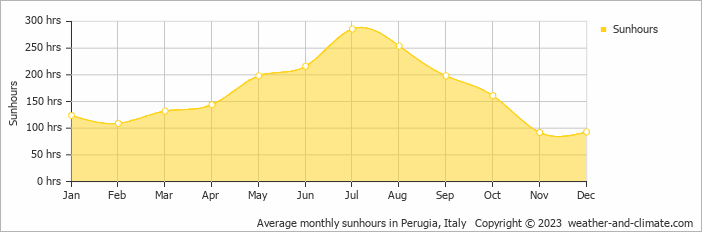
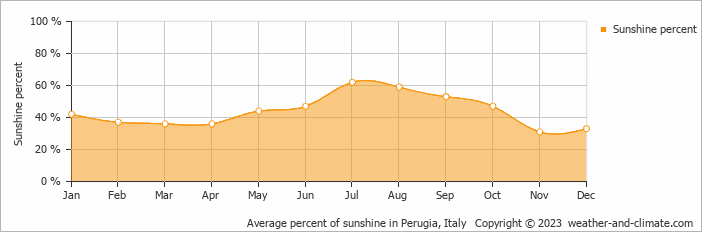
For those who appreciate different seasons, Graffignano serves as an ideal destination. Expect longer, more sun-filled days in July with an average of 9.5 hours of sunshine daily, and embrace the darker days in November, offering only 3.1 hours of daily sunlight.
Visit our detailed sunshine hours page for more information.
Monthly hours of sunshine
Daily hours of sunshine
Daily percentage of sunshine
Humidity in Graffignano by Month
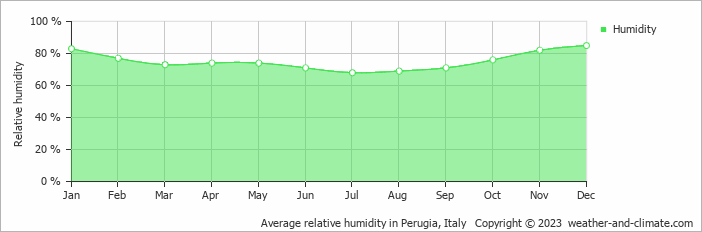
The relative humidity is high throughout the year in Graffignano.
The city experiences its highest humidity in December, reaching 85%. In July, the humidity drops to its lowest level at 68%. What does this mean? Read our detailed page on humidity levels for further details.
Relative humidity over the year
Graffignano 3-Day Forecast
Check the conditions for any month of the year.


