Gaiola Weather & Climate: Best Time to Visit
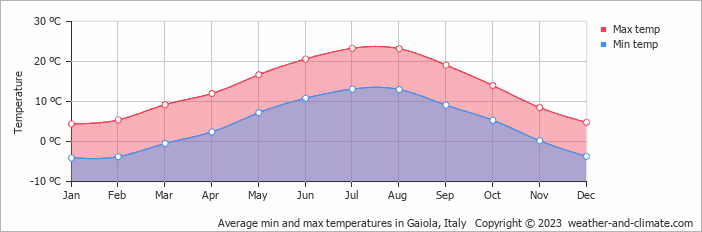
Gaiola, Piedmont, Italy, experiences significant temperature variation throughout the year. Summers bring daytime highs of 23°C (73°F) in July, while winters cool to 4°C (39°F) in January.
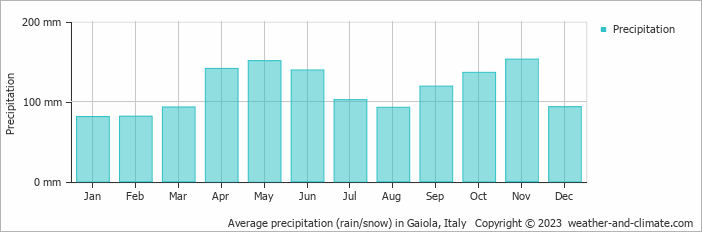
The city receives considerable rain/snowfall, with around 1382 mm (54 in) annually. November is the wettest month. The most sunshine falls in July, with an average of 11.4 hours of daily sunshine.
Monthly Temperature in Gaiola
Depending on the time of the year, temperatures range from comfortable to chilly in Gaiola. Typically, average maximum daytime temperatures range from a comfortable 23°C (73°F) in July to a chilly 4°C (39°F) in the coolest month, January.
Nights vary from 13°C (55°F) in July to around -4°C (25°F) during the colder months.Check out our detailed temperature page for more information.
Temperature ranges by month
Rainfall in Gaiola
Gaiola has a relatively rain/snowy climate with high precipitation levels, averaging 1382 mm (54 in) of rain/snowfall annually. Gaiola offers a pleasant mix of wetter and slightly drier months. The difference in precipitation between the wettest month November (153 mm (6 in)) and the driest month January (81 mm (3.2 in)) is not too significant. For more details, please visit our Gaiola Precipitation page.
The mean monthly precipitation over the year, including rain, hail, and snow
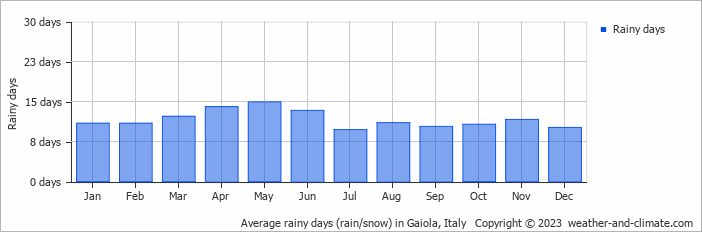
The average number of days each month with precipitation
Sunshine Hours in Gaiola
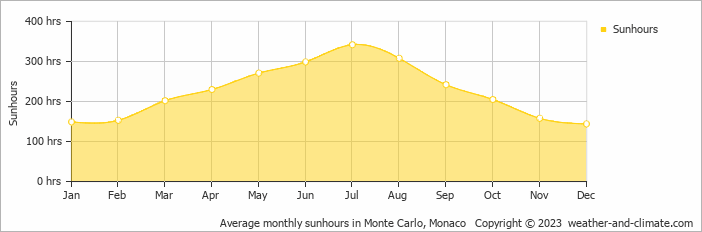
For those who appreciate different seasons, Gaiola serves as an ideal destination. Expect longer, more sun-filled days in July with an average of 11.4 hours of sunshine daily, and embrace the darker days in December, offering only 4.8 hours of daily sunlight.
Visit our detailed sunshine hours page for more information.
Monthly hours of sunshine
Daily hours of sunshine
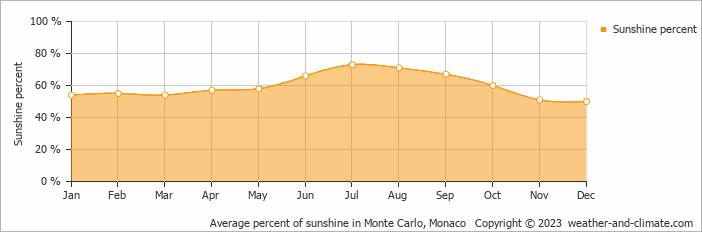
Daily percentage of sunshine
Gaiola 3-Day Forecast
Check the conditions for any month of the year.
Best Time to Visit Gaiola
During the months of June, July, August and September, Gaiola enjoys pleasant weather with average temperatures ranging from 19°C (66°F) to 23°C (74°F). These months are perfect for sightseeing and exploring.Rainfall during this time ranges from 93 mm (3.7 in) in August to 139 mm (5.5 in) in June. This means you can expect a mix of sunny days and occasional showers. Wondering where to travel based on your weather preferences? Our recommendation tool helps you find destinations with your ideal climate conditions. Use our weather planner to find your perfect destination.


