El Morro Weather & Climate: Best Time to Visit
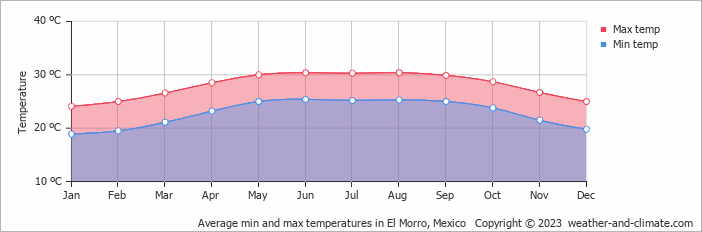
The climate in El Morro, Veracruz, Mexico, is remarkably consistent, with temperatures year-round averaging 28°C (82°F). The warmest month is June at 30°C (86°F), and the coolest is January at 24°C (75°F).
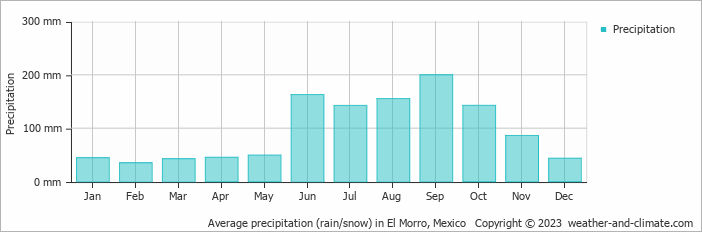
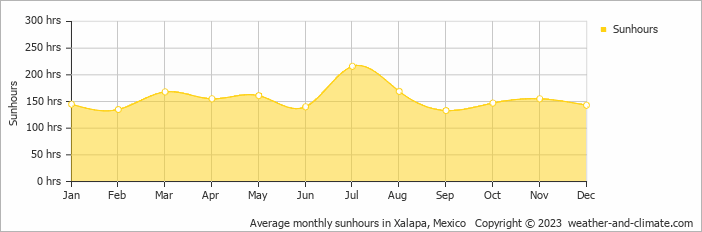
The city receives considerable rainfall, with around 1147 mm (45 in) annually. September is the wettest month. The sunniest month is July, with 7.2 hours of sunshine per day on average.
Monthly Temperature in El Morro
In El Morro temperatures are generally consistent throughout the year. Typically, average maximum daytime temperatures range from a very warm 30°C (86°F) in June to a comfortable 24°C (75°F) in the coolest month, January.
Nights vary from 25°C (77°F) in June to around 19°C (66°F) during the colder months.
Check out our detailed temperature page for more information.
Temperature ranges by month
Rainfall in El Morro
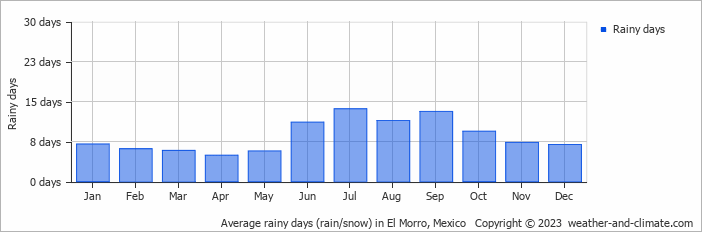
El Morro experiences significant rainfall throughout the year, averaging 1147 mm (45 in) of precipitation annually. The climate in El Morro shows significant variation throughout the year. Expect heavy rainfall in September, the wettest month, with an average of 200 mm (7.9 in) of precipitation over 13 rainy days.
In contrast, the driest month February offers drier and sunnier days, with around 35 mm (1.4 in) of rainfall over 6 rainy days. For more details, please visit our El Morro Precipitation page.
The mean monthly precipitation over the year, including rain, hail, and snow
The average number of days each month with precipitation
Sunshine Hours in El Morro
El Morro offers a pleasant mix of sunny and slightly overcast days. The difference in sunshine hours between July (7.2 hours daily) and September (4.4 hours daily) provides a bit of variety for visitors and residents.
Visit our detailed sunshine hours page for more information.
Monthly hours of sunshine
Daily hours of sunshine
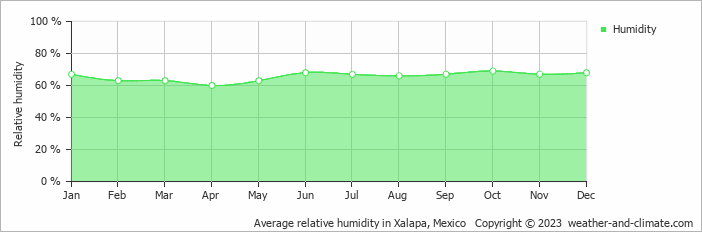
Humidity in El Morro by Month
The relative humidity is high throughout the year in El Morro.
The city experiences its highest humidity in October, reaching 69%. In April, the humidity drops to its lowest level at 60%. What does this mean? Read our detailed page on humidity levels for further details.
Relative humidity over the year
El Morro 3-Day Forecast
Check the conditions for any month of the year.
Best Time to Visit El Morro
The best time to visit El Morro is during January, February, March, November and December, when the weather provides comfortable temperatures between 24°C (75°F) and 27°C (80°F). With rainfall of 35 mm (1.4 in) to 86 mm (3.4 in), you can expect pleasant weather during your visit in these months.Be prepared for heavier rainfall during June and September, the wettest period of the year. Wondering where to travel based on your weather preferences? Our recommendation tool helps you find destinations with your ideal climate conditions. Use our weather planner to find your perfect destination.


