Dorval (QC) Weather & Climate: Best Time to Visit
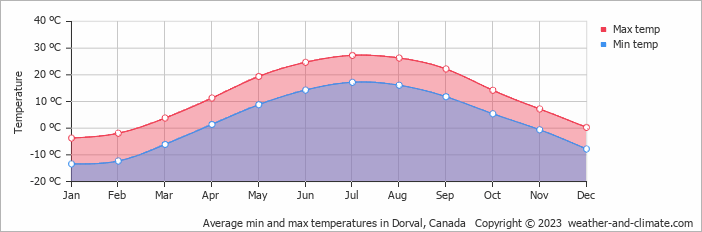
Dorval, Quebec, Canada, sees big temperature differences between seasons, with July peaking at 27°C (81°F) and January dropping to -4°C (25°F).
Rain/snowfall is high, totalling around 1125 mm (44 in) per year. October is the wettest month and February the driest. The most sunshine falls in July, with an average of 9.1 hours of daily sunshine.
Monthly Temperature in Dorval
Visitors to Dorval can expect significant temperature changes throughout the year. Average maximum daytime temperatures range from a comfortable 27°C (81°F) in July, the warmest time of the year, to a very cold -4°C (25°F) during cooler months like January.
At night, you can expect temperatures ranging from 17°C (63°F) in July to around -13°C (9°F) during January.
Check out our detailed temperature page for more information.
Temperature ranges by month
Rainfall in Dorval
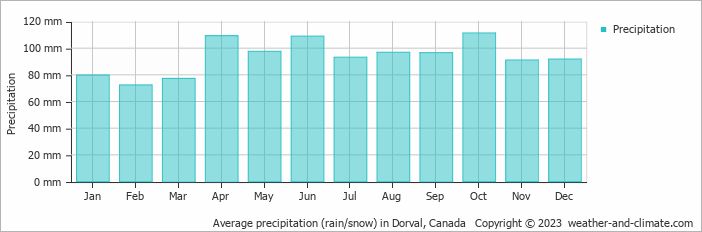
Dorval is known for its substantial rain/snowfall, with annual precipitation reaching 1125 mm (44 in). Year-round, Dorval has a balanced climate with minimal variation in precipitation. The difference between the wettest month, October, with 111 mm (4.4 in), and the driest month, February, with 72 mm (2.8 in), is minimal. For more details, please visit our Dorval Precipitation page.
The mean monthly precipitation over the year, including rain, hail, and snow
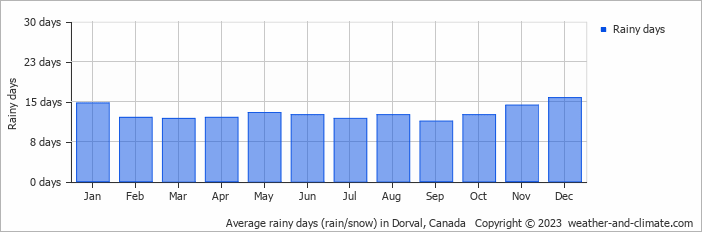
The average number of days each month with precipitation
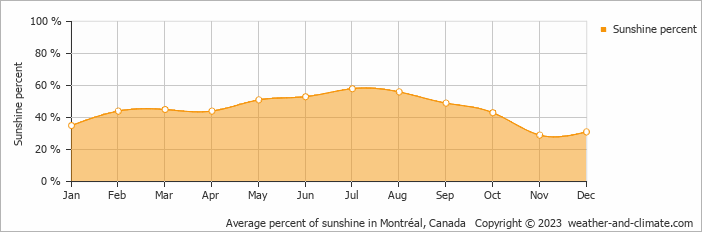
Sunshine Hours in Dorval
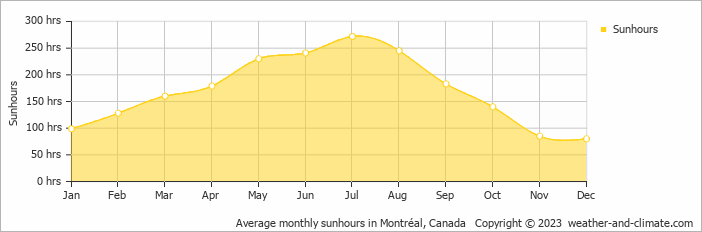
Seasonal changes in sunshine hours are quite dramatic in Dorval. While July receives considerable daily sunshine with up to 9.1 hours, December marks the darkest time of the year, where sunshine is scarce with only 2.7 hours of sunlight per day.
Visit our detailed sunshine hours page for more information.
Monthly hours of sunshine
Daily hours of sunshine
Daily percentage of sunshine
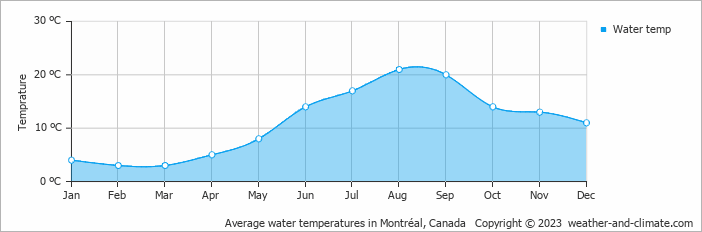
Water Temperature in Dorval
The mean water temperature over the year ranges from 3°C (37°F) in February to 21°C (70°F) in August.
Water temperature over the year
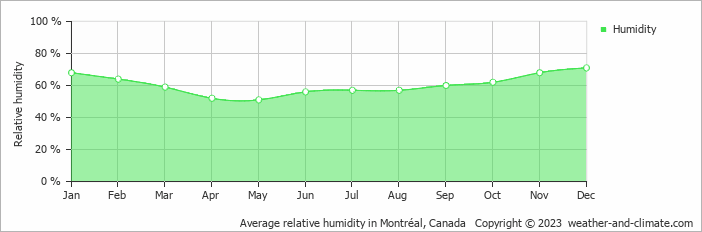
Humidity in Dorval by Month
The relative humidity is high throughout the year in Dorval.
The city experiences its highest humidity in December, reaching 71%. In May, the humidity drops to its lowest level at 51%. What does this mean? Read our detailed page on humidity levels for further details.
Relative humidity over the year
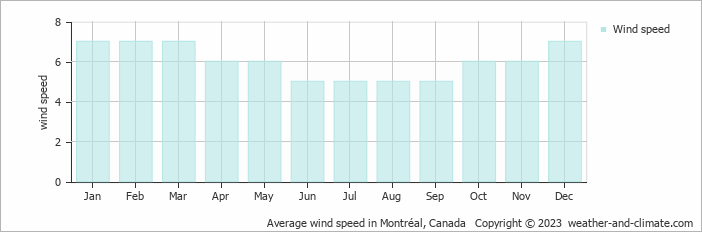
Wind Speed in Dorval
The average wind speed over the year ranges from 5 m/s (10 knots) to 7 m/s (14 knots). It is lower in June, July, August and September and higher in January, February, March and December. What does this mean?
The mean monthly wind speed over the year (meters per second)
Dorval (QC) 3-Day Forecast
Check the conditions for any month of the year.
Best Time to Visit Dorval
During May, June, July, August and September, Dorval experiences its most favorable weather, with temperatures between 19°C (67°F) and 27°C (81°F). These mild conditions make it an excellent time for a visit.The weather does bring rainfall during this period, between 93 mm (3.7 in) and 109 mm (4.3 in). Need help choosing your next travel destination? We offer a specialized tool that matches you with locations based on your weather preferences. Explore destinations that suit your climate preferences.


