Dattilo Weather and Climate: A Comprehensive Guide
The climate in Dattilo is marked by big temperature swings throughout the year.
Temperatures range from very warm during the warmest months
to mild in the cooler months.
It receives a moderate amount of precipitation.
Let’s explore the climate details in depth to provide you with a complete overview.
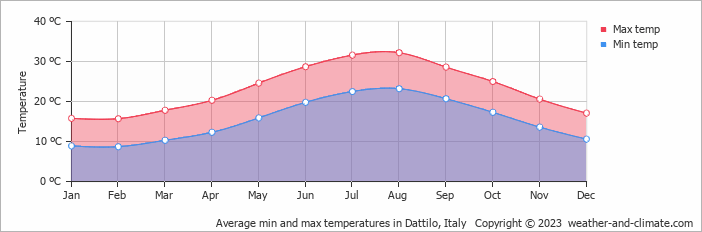
Average maximum day and minimum night temperature
In Dattilo, temperatures differ significantly between summer and winter months. On average, daytime temperatures range from a very warm 32°C in August to a moderate 16°C in February.
Nighttime temperatures can drop, with average lows reaching 9°C in February.Check out our detailed temperature page for more information.
Temperature ranges by month
Precipitation and rainy days
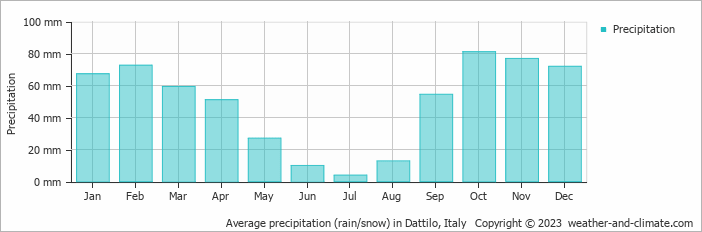
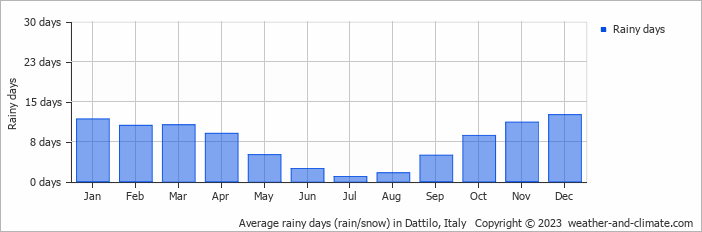
On average, Dattilo receives a reasonable amount of rainfall, with an annual precipitation of 588 mm. The seasons in Dattilo, bring significant changes in precipitation. The wettest month, October, receives moderate rainfall, with an average of 81 mm of precipitation. This rainfall is distributed across 9 rainy days.
In contrast, the driest month, July, experiences much less rainfall, totaling 3.9 mm over a single rainy day. These distinct seasonal differences provide diverse experiences throughout the year. For more details, please visit our Dattilo Precipitation page.The mean monthly precipitation over the year, including rain, hail and snow
The average number of days each month with precipitation
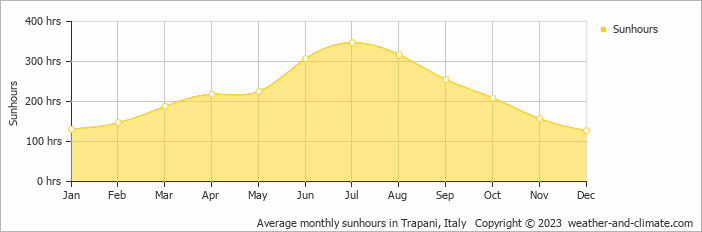
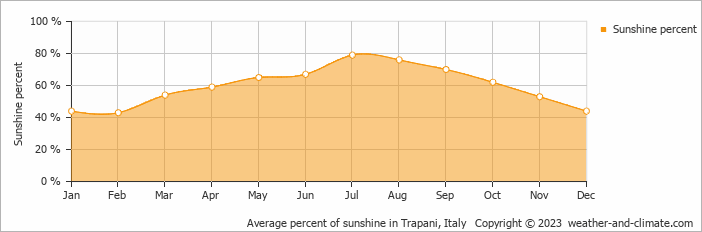
Sunshine over the year
In Dattilo, summer days are longer and more sunny, with daily sunshine hours peaking at 11.6 hours in July. As the darker season arrives, the brightness of the sun becomes less. December sees a soft sun for only 4.2 hours per average day.
Visit our detailed sunshine hours page for more information.
Monthly hours of sunshine
Daily hours of sunshine
Daily percentage of sunshine
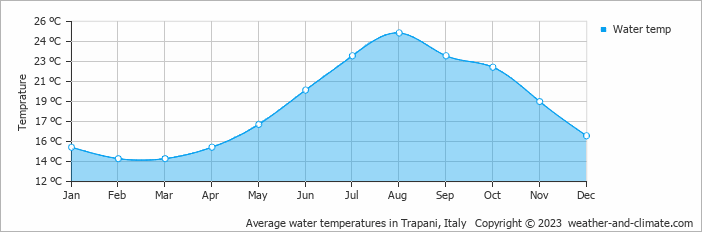
Average water temperature
The mean water temperature over the year ranges from 14°C in February to 25°C in August.
Water temperature over the year
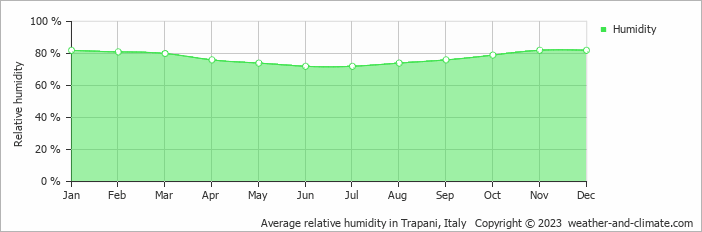
Average humidity
The relative humidity is high throughout the year in Dattilo.
The city experiences its highest humidity in January, reaching 82%. In June, the humidity drops to its lowest level at 72%. What does this mean? Read our detailed page on humidity levels for further details.
Relative humidity over the year
Forecast for Dattilo


Select a Month of Interest
Check the conditions for any month of the year.
The best time of year to visit Dattilo in Italy
During the months of April, May, October and November you are most likely to experience good weather with pleasant average temperatures that fall between 20°C and 26°C.Other facts from our historical weather data:
Yes, the months of June, July and August are very dry.
August has an average maximum temperature of 32°C and is the warmest month of the year.
The coldest month is February with an average maximum temperature of 16°C.
October tops the wettest month list with 81 mm of rainfall.
July is the driest month with 4 mm of precipitation.
July is the sunniest month with an average of 347 hours of sunshine.
No idea where to travel to this year? We have a tool that recommends destinations based on your ideal conditions. Find out where to go with our weather planner.


