Civitella del Tronto Weather and Climate: A Comprehensive Guide
Civitella del Tronto experiences great temperature shifts.
The city's weather can transition from warm days
to cold weather.
It also experiences much rain/snowfall throughout the year.
Let’s explore the climate details in depth to provide you with a complete overview.
Average maximum day and minimum night temperature
The climate in Civitella del Tronto is known for significant temperature differences throughout the year, making the weather dynamic. Average daytime temperatures reach a comfortable 28°C in August. In February, the coolest month of the year, temperatures drop to a chilly 9°C.
At night, you can expect cooler temperatures, with averages dropping to around 2°C during this month. Check out our detailed temperature page for more information.Temperature ranges by month

Precipitation and rainy days
Civitella del Tronto has a notably wet climate with abundant precipitation, recording 1047 mm of rain/snowfall per year. Despite minor fluctuations, Civitella del Tronto enjoys fairly consistent precipitation throughout the year. In May, you can expect around 105 mm of precipitation, while in July, Civitella del Tronto receives about 68 mm.The mean monthly precipitation over the year, including rain, hail and snow
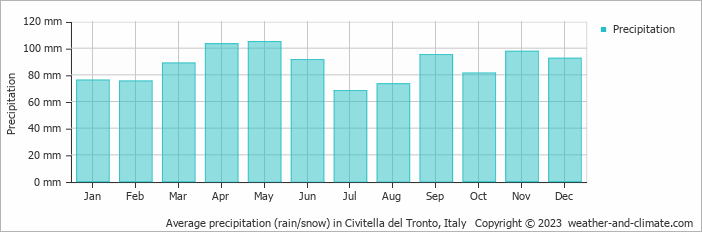
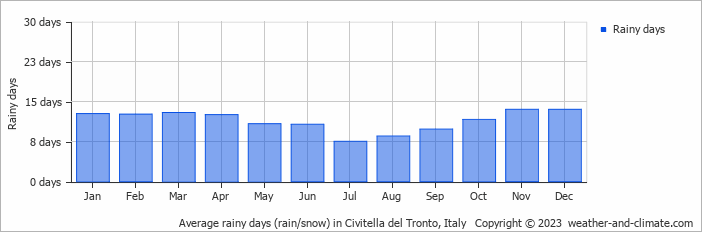
The average number of days each month with precipitation
Sunshine over the year
Civitella del Tronto can be enjoyed more throughout the sunniest month of July under a blue sky, with approximately 10.1 hours of sunshine daily. In contrast, the city experiences much darker days in December, with only 3.0 hours of sunlight per day. Visit our detailed sunshine hours page for more information.Monthly hours of sunshine
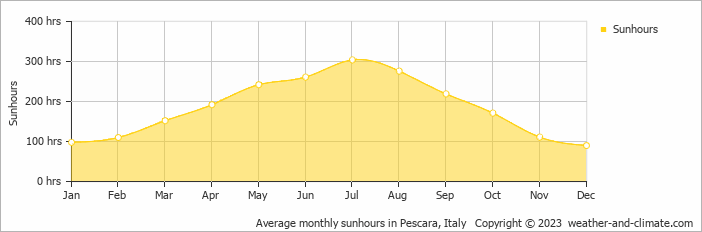
Daily hours of sunshine
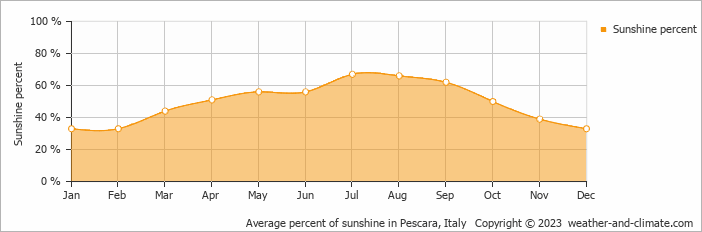
Daily percentage of sunshine
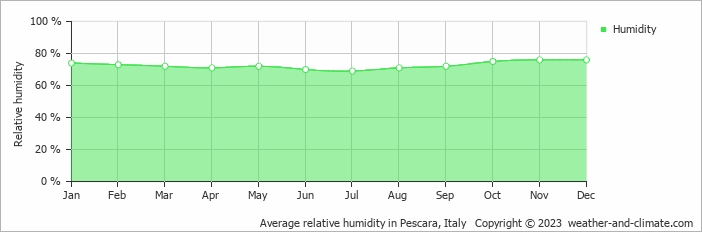
Average humidity
The relative humidity is high throughout the year in Civitella del Tronto.
The city experiences its highest humidity in November, reaching 76%. In July, the humidity drops to its lowest level at 69%. Explore our detailed page on humidity levels for further details.
Relative humidity over the year
partly cloudy and chance of slight rain broken clouds and chance of slight rain broken clouds and rainForecast for Civitella del Tronto
 2 m/s
2 m/s![]() 6 m/s
6 m/s![]() 4 m/s
4 m/s![]()
The best time of year to visit Civitella del Tronto in Italy
During the months of May, June and September you are most likely to experience good weather with pleasant average temperatures that fall between 20°C and 26°C.Other facts from our historical weather data:
August has an average maximum temperature of 28°C and is the warmest month of the year.
The coldest month is February with an average maximum temperature of 9°C.
May tops the wettest month list with 105 mm of rainfall.
July is the driest month with 68 mm of precipitation.
July is the sunniest month with an average of 304 hours of sunshine.
No idea where to travel to this year? We have a tool that recommends destinations based on your ideal conditions. Find out where to go with our weather planner.


