Civitella Casanova Climate by Month
The temperature in Civitella Casanova can vary greatly throughout the year.
The temperatures shift from warm
to cold.
It maintains moderate precipitation patterns.
Let's now guide you through the climate details for a complete overview.
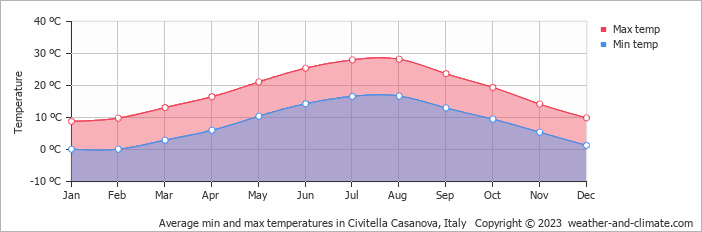
Average day and night temperature
Depending on the time of the year, temperatures range from comfortable to chilly in Civitella Casanova. Typically, daytime temperatures range from a comfortable 28°C in August to a chilly 9°C in the coolest month, January. Nights are cooler, with temperatures generally dropping to 0°C, particularly during the colder months.
The mean minimum and maximum temperatures throughout the year
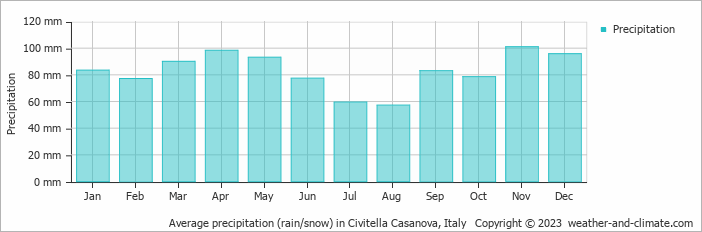
Precipitation and rainy days
Generally, Civitella Casanova has a moderate amount of precipitation, averaging 994 mm of rain/snowfall annually. Civitella Casanova offers a pleasant mix of wetter and slightly drier months. The difference in precipitation between November (101 mm) and August (57 mm) is not too significant, making the climate enjoyable for visitors and residents alike.The mean monthly precipitation over the year, including rain, hail and snow
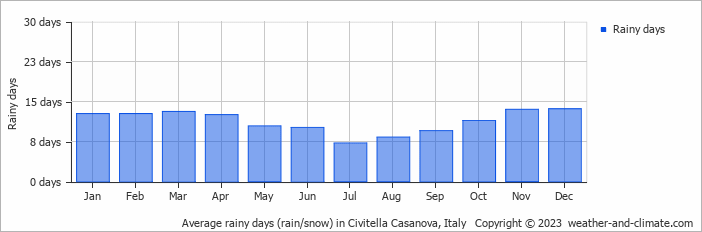
The average number of days each month with precipitation
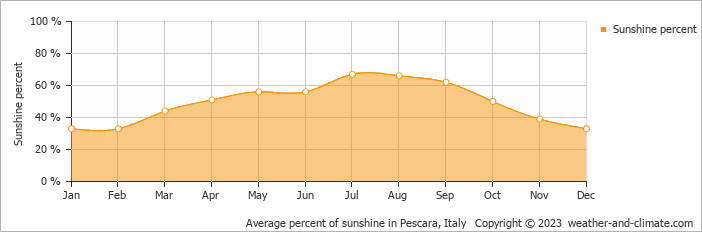
Sunshine over the year
For those who appreciate different seasons, Civitella Casanova serves as an ideal destination. Expect longer, more sun-filled days in July with an average of 10.1 hours of sunshine daily, and embrace the darker days in December, offering only 3.0 hours of daily sunlight.Monthly hours of sunshine
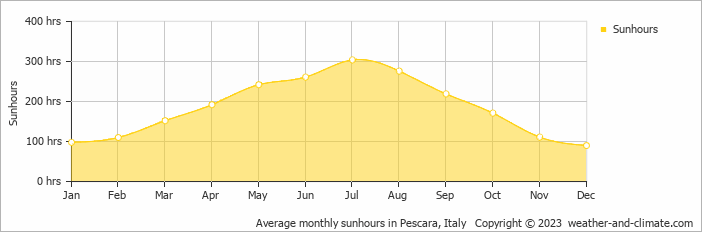
Daily hours of sunshine
Daily percentage of sunshine
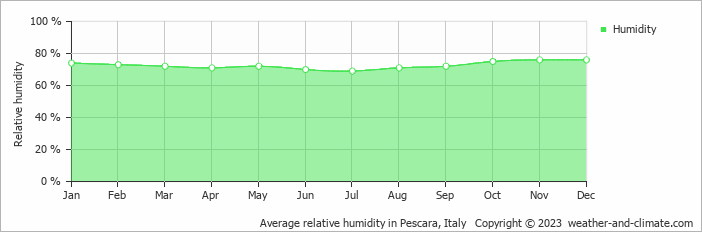
Average humidity
The relative humidity is moderate throughout the year in Civitella Casanova.
Relative humidity over the year
The best time of year to visit Civitella Casanova in Italy
During the months of May, June and September you are most likely to experience good weather with pleasant average temperatures that fall between 20°C and 26°C.Other facts from our historical weather data:
August has an average maximum temperature of 28°C and is the warmest month of the year.
The coldest month is January with an average maximum temperature of 9°C.
November tops the wettest month list with 101 mm of rainfall.
August is the driest month with 57 mm of precipitation.
July is the sunniest month with an average of 304 hours of sunshine.
No idea where to travel to this year? We have a tool that recommends destinations based on your ideal conditions. Find out where to go with our weather planner.


