Chambord (QC) Weather & Climate: Best Time to Visit
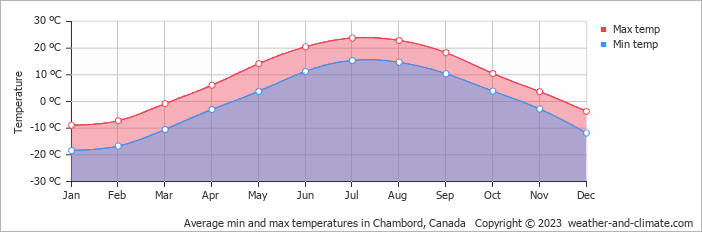
Temperatures in Chambord, Quebec, Canada, vary greatly throughout the year. July is the hottest month at 24°C (75°F), while January is the coldest at -9°C (16°F).
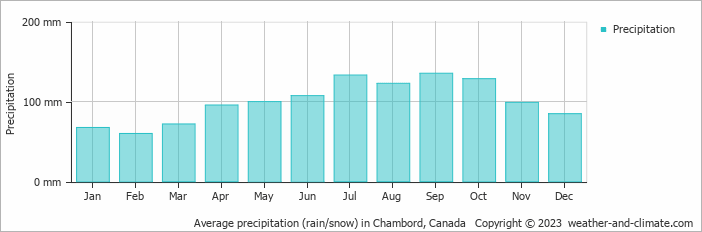
The city receives considerable rain/snowfall, with around 1203 mm (47 in) annually. September is the wettest month.
Monthly Temperature in Chambord
The climate in Chambord is known for significant temperature differences throughout the year, making the weather dynamic. Typically, average maximum daytime temperatures range from a comfortable 24°C (75°F) in July to a very cold -9°C (16°F) in the coolest month, January.
Nights vary from 15°C (59°F) in July to around -18°C (0°F) during the colder months.
Check out our detailed temperature page for more information.
Temperature ranges by month
Rainfall in Chambord
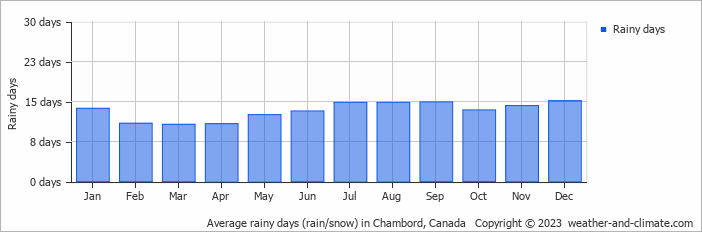
Chambord has a notably wet climate with abundant precipitation, recording 1203 mm (47 in) of rain/snowfall per year. The climate in Chambord shows significant variation throughout the year. Expect high rainfall in September, the wettest month, with an average of 135 mm (5.3 in) of precipitation over 15 rainy days.
In contrast, the driest month February offers drier and sunnier days, with around 60 mm (2.4 in) of snowfall over 11 snowy days. For more details, please visit our Chambord Precipitation page.
The mean monthly precipitation over the year, including rain, hail, and snow
The average number of days each month with precipitation
Chambord (QC) 3-Day Forecast
Check the conditions for any month of the year.


