Cascia Weather & Climate: Best Time to Visit
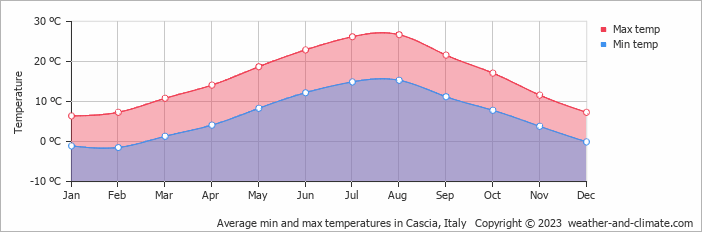
Cascia, Umbria, Italy, sees big temperature differences between seasons, with August peaking at 27°C (81°F) and February dropping to 6°C (43°F).
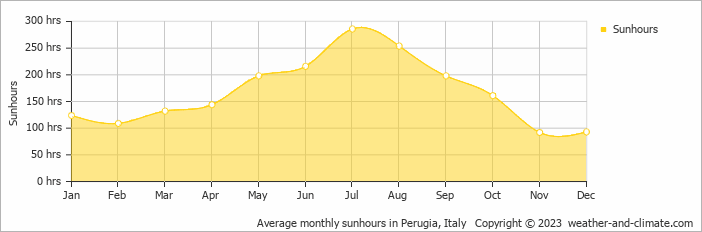
Rain/snowfall is high, totalling around 1031 mm (41 in) per year. November is the wettest month and August the driest. July is the sunniest month, averaging 9.5 hours of sunshine per day.
Monthly Temperature in Cascia
Visitors to Cascia can expect significant temperature changes throughout the year. Average maximum daytime temperatures range from a comfortable 27°C (81°F) in August, the warmest time of the year, to a chilly 6°C (43°F) during cooler months like February.
At night, you can expect temperatures ranging from 15°C (59°F) in August to around -2°C (28°F) during February.
Check out our detailed temperature page for more information.
Temperature ranges by month
Rainfall in Cascia
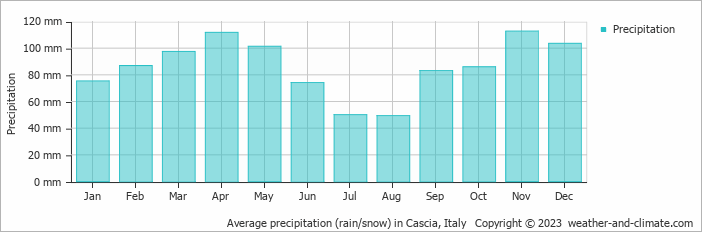
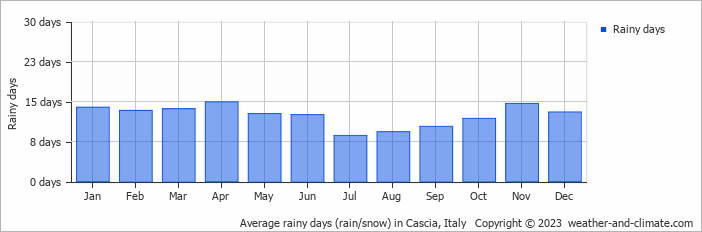
Cascia is known for its substantial rain/snowfall, with annual precipitation reaching 1031 mm (41 in). Significant seasonal changes in precipitation occur throughout the year. In the wettest month, November it receives high rainfall, averaging 113 mm (4.4 in) of precipitation, recorded across 15 rainy days. In contrast, the driest month August brings less rainfall, with 49 mm (1.9 in) over 9 rainy days. For more details, please visit our Cascia Precipitation page.
The mean monthly precipitation over the year, including rain, hail, and snow
The average number of days each month with precipitation
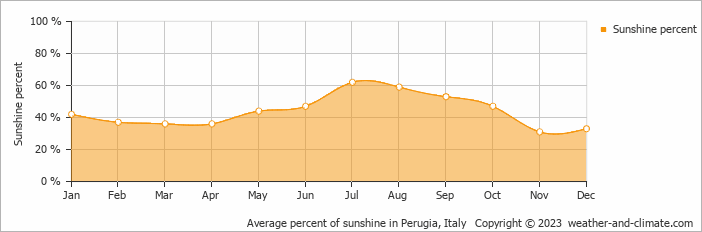
Sunshine Hours in Cascia
Seasonal changes in sunshine hours are quite dramatic in Cascia. While July receives considerable daily sunshine with up to 9.5 hours, November marks the darkest time of the year, where sunshine is scarce with only 3.1 hours of sunlight per day.
Visit our detailed sunshine hours page for more information.
Monthly hours of sunshine
Daily hours of sunshine
Daily percentage of sunshine
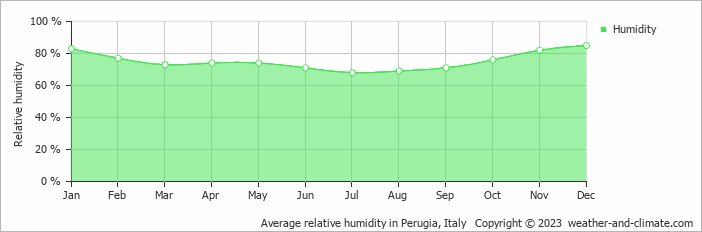
Humidity in Cascia by Month
The relative humidity is high throughout the year in Cascia.
The city experiences its highest humidity in December, reaching 85%. In July, the humidity drops to its lowest level at 68%. What does this mean? Read our detailed page on humidity levels for further details.
Relative humidity over the year
Cascia 3-Day Forecast
Check the conditions for any month of the year.
Best Time to Visit Cascia
During May, June, July, August and September, Cascia experiences its most favorable weather, with temperatures between 19°C (66°F) and 27°C (80°F). These mild conditions make it an excellent time for a visit.The weather does bring rainfall during this period, between 49 mm (1.9 in) and 101 mm (4 in). Seeking the perfect travel destination for this year? We've created a tool that suggests locations matching your desired weather. Let our weather planner guide your travel decisions.


