Cantalupa Climate by Month
The climate in Cantalupa is marked by big temperature swings throughout the year.
Temperatures range from warm during the warmest months
to cold in the cooler months.
It is also known for its large amounts of rain/snowfall.
Now, let’s break down all the climate details for a clearer picture.
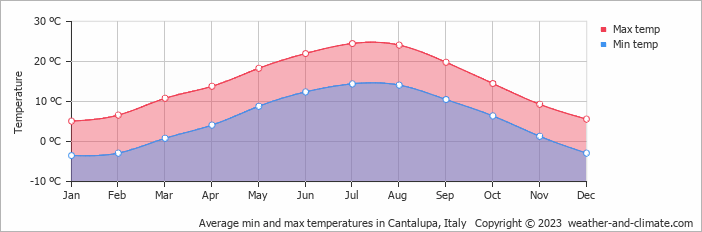
Average day and night temperature
In Cantalupa, temperatures differ significantly between summer and winter months. Typically, daytime temperatures range from a comfortable 25°C in July to a chilly 5°C in the coolest month, January. Nights are cooler, with temperatures generally dropping to -4°C, particularly during the colder months.
The mean minimum and maximum temperatures throughout the year
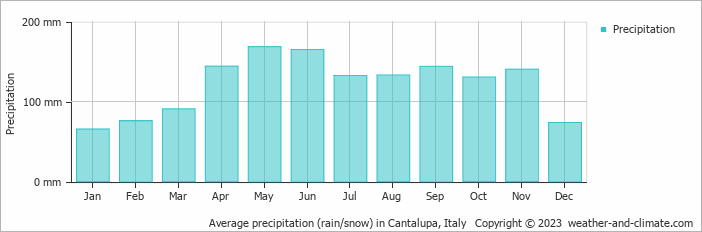
Precipitation and rainy days
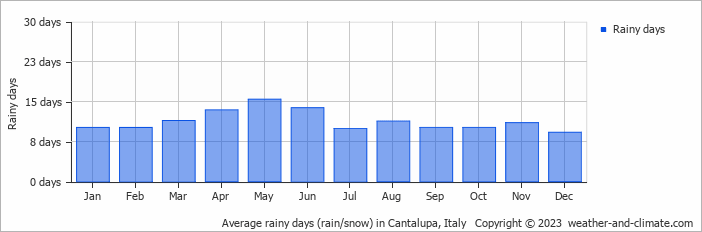
Cantalupa experiences significant rain/snowfall throughout the year, averaging 1462 mm of precipitation annually. The climate in Cantalupa shows significant variation throughout the year. Expect heavy rainfall in May, with an average of 168 mm of precipitation over 15 rainy days. In contrast, January offers drier and sunnier days, with around 65 mm of snow/rainfall over 10 snowy/rainy days.The mean monthly precipitation over the year, including rain, hail and snow
The average number of days each month with precipitation
Sunshine over the year
For those who appreciate different seasons, Cantalupa serves as an ideal destination. Expect longer, more sun-filled days in July with an average of 8.7 hours of sunshine daily, and embrace the darker days in November, offering only 3.5 hours of daily sunlight.Monthly hours of sunshine
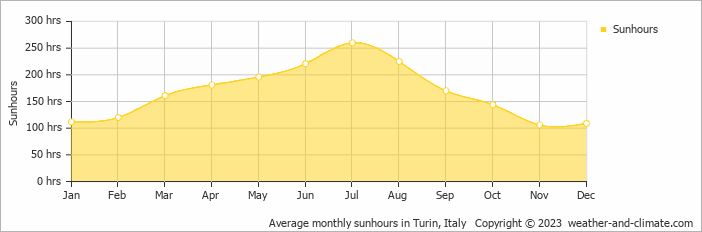
Daily hours of sunshine
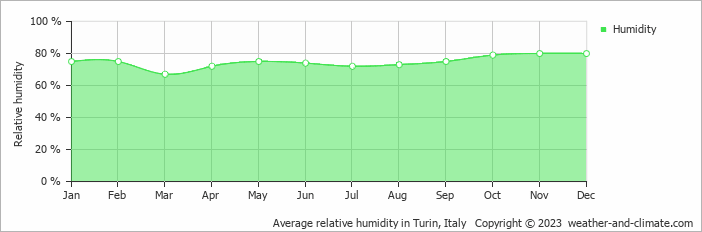
Average humidity
The relative humidity is moderate throughout the year in Cantalupa.
Relative humidity over the year
The best time of year to visit Cantalupa in Italy
During the months of June, July and August you are most likely to experience good weather with pleasant average temperatures that fall between 20°C and 26°C.Other facts from our historical weather data:
Most rainfall (rainy season) is seen in May and June.
July has an average maximum temperature of 25°C and is the warmest month of the year.
The coldest month is January with an average maximum temperature of 5°C.
May tops the wettest month list with 168 mm of rainfall.
January is the driest month with 65 mm of precipitation.
July is the sunniest month with an average of 260 hours of sunshine.
No idea where to travel to this year? We have a tool that recommends destinations based on your ideal conditions. Find out where to go with our weather planner.


