Bukhara Weather & Climate: Best Time to Visit
Average temperatures, rainfall, sunshine and the best time to visit Bukhara.
Climate overview of Bukhara
Bukhara, Uzbekistan, experiences significant temperature variation throughout the year. Summers bring daytime highs of 39°C (102°F) in July, while winters cool to 8°C (46°F) in January.
With just 167 mm (6.6 in) of annual rain/snowfall, the city has a dry, desert-like climate.
Bukhara Weather by Month
Pick a month to see the average temperature, rainfall and sunshine in Bukhara — and find the best time to visit.
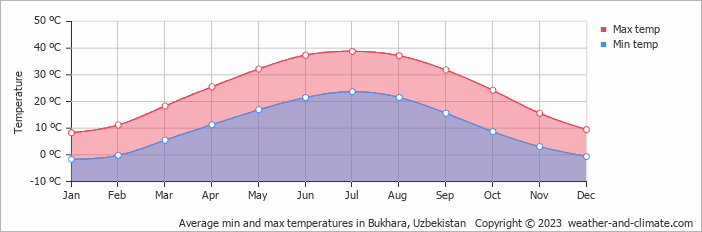
Monthly Temperature in Bukhara
Depending on the time of the year, temperatures range from very hot to chilly in Bukhara. Average daytime temperatures reach a very hot 39°C (102°F) in July. In January, the coolest month of the year, temperatures drop to a chilly 8°C (46°F).
At night, temperatures range from around 24°C (75°F) in July to -2°C (28°F) in January.
Check out our detailed temperature page for more information.
Temperature ranges by month
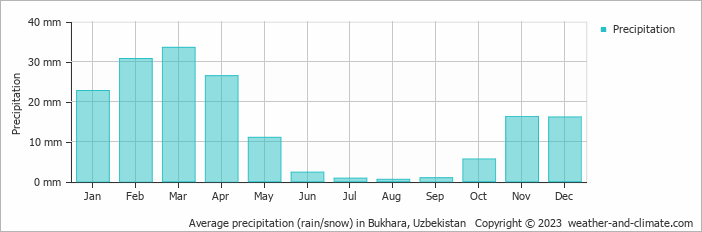
Rainfall in Bukhara
Bukhara has a dry climate with very low precipitation, averaging 167 mm (6.6 in) of rain/snowfall annually. Bukhara can be quite wet during March, receiving approximately 34 mm (1.3 in) of precipitation over 8 rainy days.
In contrast, during the driest month (August), you will experience much drier conditions, with 0.5 mm (0.02 in) of precipitation spread across 0 rainy days days. For more details, please visit our Bukhara Precipitation page.
The mean monthly precipitation over the year, including rain, hail, and snow
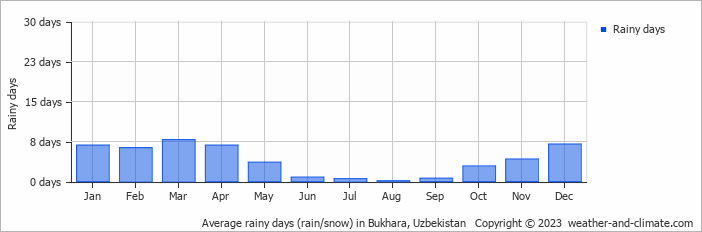
The average number of days each month with precipitation
Best Time to Visit Bukhara
The consistently dry weather means you can step outside without worrying about rain, though remember to carry water and sun protection. Ready to plan your travels but need destination ideas? Our smart tool recommends places based on the climate conditions you prefer. Start planning with our destination weather tool.
Frequently asked questions about the climate in Bukhara
What is the best time to visit Bukhara?
April and October typically offer the most optimal weather in Bukhara. In contrast, June, July and August tend to have less optimal conditions. Bukhara has a distinct dry season from January to December.
What temperatures can I expect in Bukhara?
Daytime highs range from 8°C (46°F) in January to 39°C (102°F) in July. Nighttime lows range from -2°C (28°F) to 24°C (75°F). Temperatures vary considerably through the year.
How much rain does Bukhara get?
Annual rainfall is around 167 mm (6.6 in). March is the wettest month with 34 mm (1.3 in), while August is the driest with 0.5 mm (0.02 in).
Bukhara 3-Day Forecast
Bukhara 3-Day Forecast
Bukhara on the map
Bukhara is highlighted — select any city to see its climate.
Popular this month
Where to go in June — average daytime high across popular destinations.