Brucoli Weather & Climate: Best Time to Visit
The climate in Brucoli, Sicily, Italy, is marked by large temperature swings across the seasons, ranging from 31°C (88°F) in August to 15°C (59°F) in February.
The city receives around 591 mm (23 in) of rainfall per year. It experiences a distinct dry season from April to August. October is the wettest month and July the driest. Sunshine peaks in July, when the city sees around 10.5 hours of sunshine per day.
Monthly Temperature in Brucoli
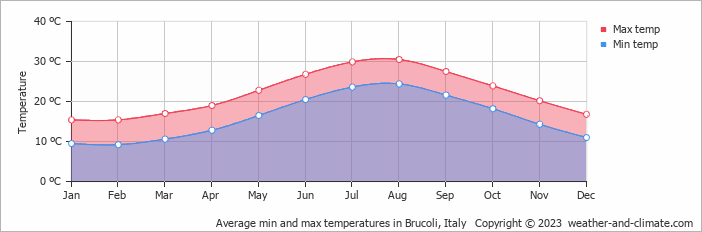
In Brucoli, temperatures differ significantly between summer and winter months. On average, daytime temperatures range from a very warm 31°C (88°F) in August to a moderate 15°C (59°F) in February.
Nighttime temperatures range from 24°C (75°F) in August to 9°C (48°F) in February.Check out our detailed temperature page for more information.
Temperature ranges by month
Rainfall in Brucoli
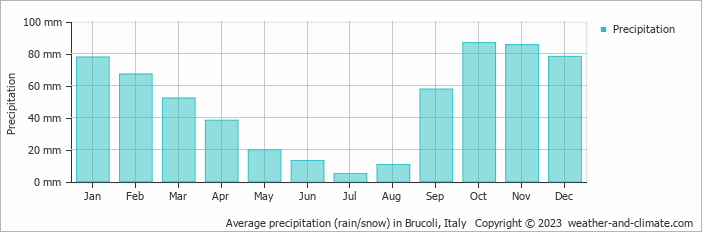
On average, Brucoli receives a reasonable amount of rainfall, with an annual precipitation of 591 mm (23 in). The seasons in Brucoli bring significant changes in precipitation. The wettest month, October, receives moderate rainfall, with an average of 87 mm (3.4 in) of precipitation. This rainfall is distributed across 7 rainy days.
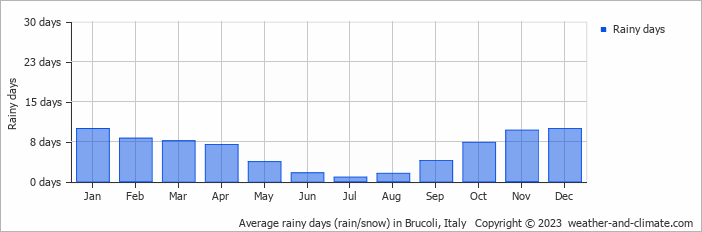
In contrast, the driest month, July, experiences much less rainfall, totaling 4.9 mm (0.2 in) over a single rainy day. These distinct seasonal differences provide diverse experiences throughout the year. For more details, please visit our Brucoli Precipitation page.The mean monthly precipitation over the year, including rain, hail, and snow
The average number of days each month with precipitation
Sunshine Hours in Brucoli
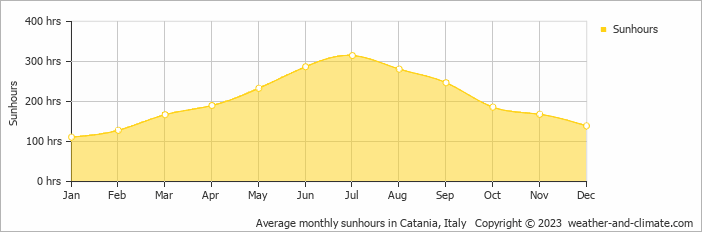
In Brucoli, summer days are longer and more sunny, with daily sunshine hours peaking at 10.5 hours in July. As the darker season arrives, the brightness of the sun becomes less. January sees a soft sun for only 3.7 hours per average day.
Visit our detailed sunshine hours page for more information.
Monthly hours of sunshine
Daily hours of sunshine
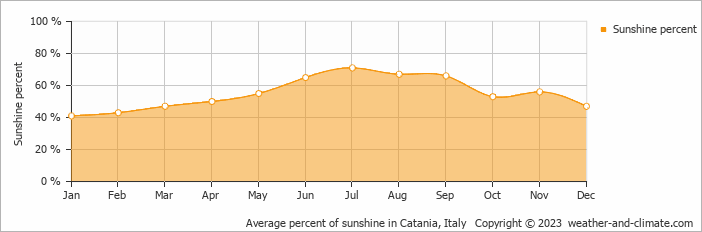
Daily percentage of sunshine
Water Temperature in Brucoli
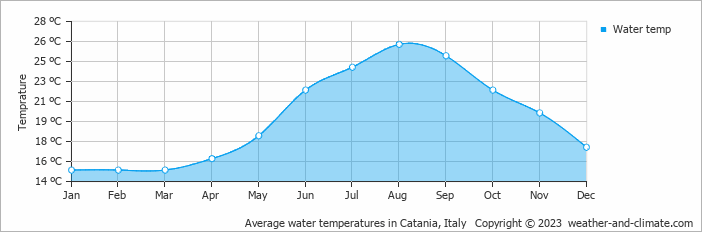
The mean water temperature over the year ranges from 15°C (59°F) in January to 26°C (79°F) in August.
Water temperature over the year
Humidity in Brucoli by Month
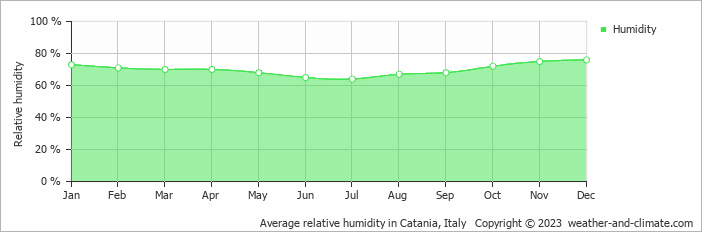
The relative humidity is high throughout the year in Brucoli.
The city experiences its highest humidity in December, reaching 76%. In July, the humidity drops to its lowest level at 64%. What does this mean? Read our detailed page on humidity levels for further details.
Relative humidity over the year
Brucoli 3-Day Forecast
Check the conditions for any month of the year.


