Aragona Climate by Month
The temperature in Aragona can vary quite a bit throughout the year.
Temperatures can be very warm during the warmest months,
and mild during the cooler months.
It receives mid-range precipitation levels.
Let's now guide you through the climate details for a complete overview.
Average day and night temperature
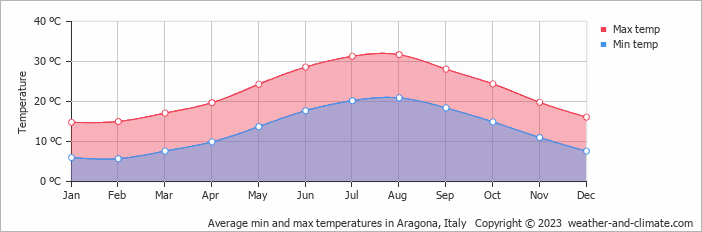
Visitors to Aragona can expect significant temperature changes throughout the year. Average daytime temperatures range from a very warm 32°C in August, the warmest time of the year, to a moderate 15°C during cooler months like February. At night, temperatures typically average around 6°C during these months.
The mean minimum and maximum temperatures throughout the year
Precipitation and rainy days
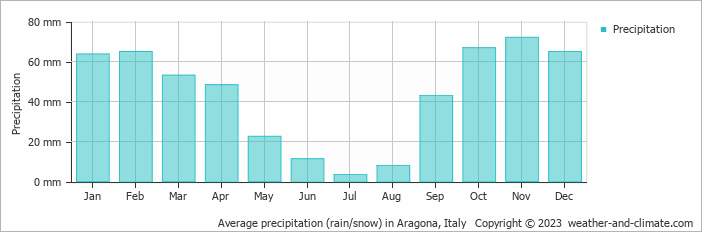
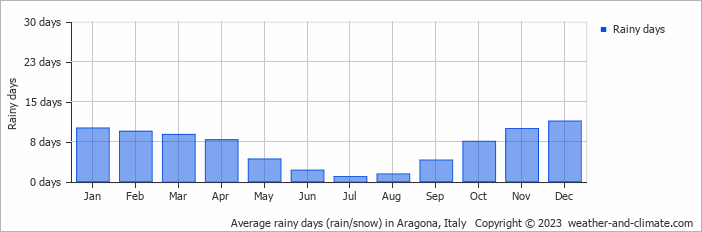
Generally, Aragona experiences moderate precipitation patterns, averaging 522 mm yearly. Significant seasonal changes in precipitation occur throughout the year. During the wetter season, November receives moderate rainfall, averaging 72 mm of precipitation, recorded across 10 rainy days. In contrast, the drier season, July brings less rainfall, with 3.4 mm over a single rainy day.The mean monthly precipitation over the year, including rain, hail and snow
The average number of days each month with precipitation
Sunshine over the year
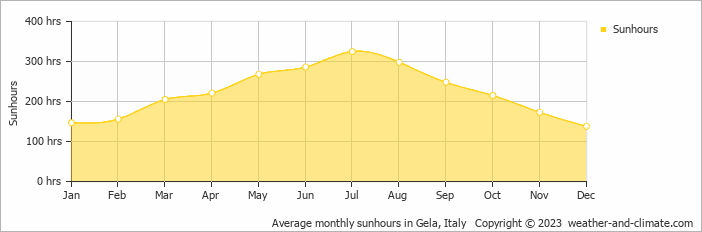
Seasonal changes in sunshine hours are quite dramatic in Aragona. While July receives considerable daily sunshine with up to 10.8 hours, December marks the darkest time of the year, where sunshine is scarce with only 4.6 hours of sunlight per day.Monthly hours of sunshine
Daily hours of sunshine
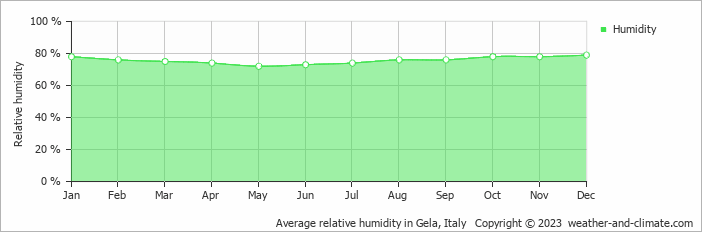
Average humidity
The relative humidity is moderate throughout the year in Aragona.
Relative humidity over the year
The best time of year to visit Aragona in Italy
During the months of May and October you are most likely to experience good weather with pleasant average temperatures that fall between 20°C and 26°C.Other facts from our historical weather data:
Yes, the months of June, July and August are very dry.
August has an average maximum temperature of 32°C and is the warmest month of the year.
The coldest month is February with an average maximum temperature of 15°C.
November tops the wettest month list with 72 mm of rainfall.
July is the driest month with 3 mm of precipitation.
July is the sunniest month with an average of 325 hours of sunshine.
No idea where to travel to this year? We have a tool that recommends destinations based on your ideal conditions. Find out where to go with our weather planner.


