Al Kharj Weather & Climate: Best Time to Visit
Average temperatures, rainfall, sunshine and the best time to visit Al Kharj.
Climate overview of Al Kharj
Al Kharj, Riyadh Province, Saudi Arabia, experiences significant temperature variation throughout the year. Summers bring daytime highs of 46°C (115°F) in July, while winters cool to 23°C (73°F) in January.
The city has an arid climate, receiving only 59 mm (2.3 in) of rainfall per year.
Al Kharj Weather by Month
Pick a month to see the average temperature, rainfall and sunshine in Al Kharj — and find the best time to visit.
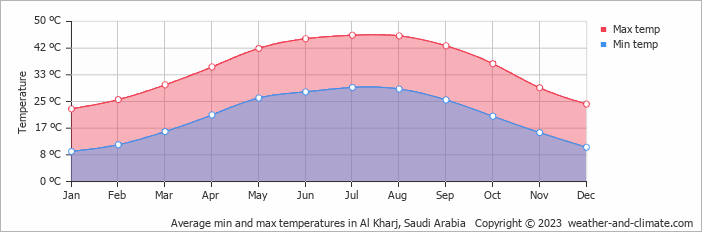
Monthly Temperature in Al Kharj
Depending on the time of the year, temperatures range from very hot to comfortable in Al Kharj. On average, daytime temperatures range from a very hot 46°C (115°F) in July to a comfortable 23°C (73°F) in January.
Nighttime temperatures range from 29°C (84°F) in July to 9°C (48°F) in January.
Check out our detailed temperature page for more information.
Temperature ranges by month
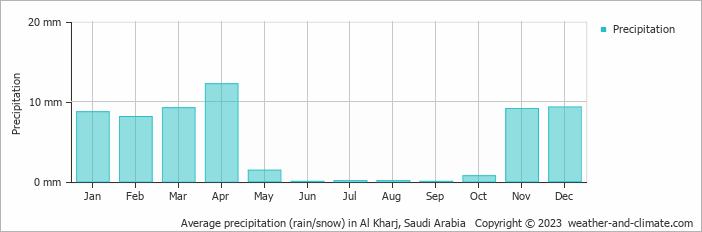
Rainfall in Al Kharj
Al Kharj has a dry climate with very low precipitation, averaging 59 mm (2.3 in) of rainfall annually. The wettest period in Al Kharj occurs in April, which receives around 12 mm (0.5 in) of precipitation. During the driest month, June, Al Kharj experiences almost no rainfall, totaling 0 mm (0 in). The consistent precipitation levels throughout the year contribute to a relatively stable climate. For more details, please visit our Al Kharj Precipitation page.
The mean monthly precipitation over the year, including rain, hail, and snow
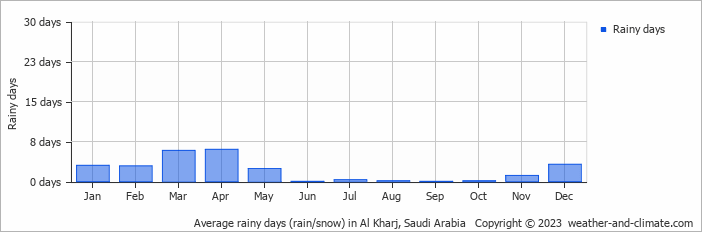
The average number of days each month with precipitation
Best Time to Visit Al Kharj
The consistently dry weather means you can step outside without worrying about rain, though remember to carry water and sun protection. Seeking the perfect travel destination for this year? We've created a tool that suggests locations matching your desired weather. Let our weather planner guide your travel decisions.
Frequently asked questions about the climate in Al Kharj
What is the best time to visit Al Kharj?
January, February, November and December typically offer the most optimal weather in Al Kharj. In contrast, April, May, June, July, August, September and October tend to have less optimal conditions. Al Kharj has a distinct dry season from January to December.
What temperatures can I expect in Al Kharj?
Daytime highs range from 23°C (73°F) in January to 46°C (115°F) in July. Nighttime lows range from 9°C (48°F) to 29°C (84°F). Temperatures vary considerably through the year.
How much rain does Al Kharj get?
Annual rainfall is around 59 mm (2.3 in). April is the wettest month with 12 mm (0.5 in), while June is the driest with 0 mm (0 in).
Al Kharj 3-Day Forecast
Al Kharj 3-Day Forecast
Al Kharj on the map
Al Kharj is highlighted — select any city to see its climate.
Popular this month
Where to go in June — average daytime high across popular destinations.