Riyadh Weather & Climate: Best Time to Visit
Average temperatures, rainfall, sunshine and the best time to visit Riyadh.
Climate overview of Riyadh
Riyadh Weather by Month
Pick a month to see the average temperature, rainfall and sunshine in Riyadh — and find the best time to visit.
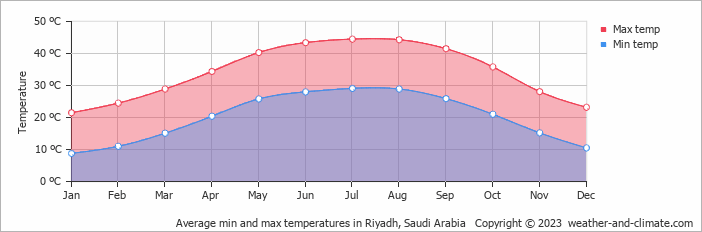
Monthly Temperature in Riyadh
Visitors to Riyadh can expect significant temperature changes throughout the year. Average maximum daytime temperatures range from a very hot 45°C (113°F) in July, the warmest time of the year, to a pleasant 22°C (72°F) during cooler months like January.
At night, you can expect temperatures ranging from 29°C (84°F) in July to around 9°C (48°F) during January.
Check out our detailed temperature page for more information.
Temperature ranges by month
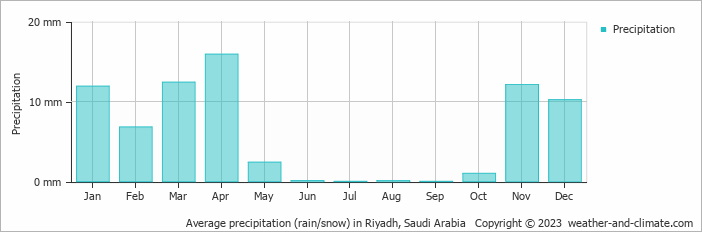
Rainfall in Riyadh
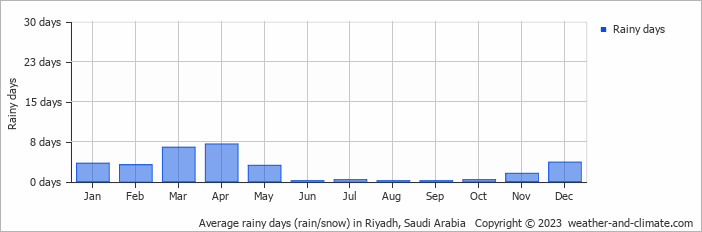
Riyadh experiences desert-like conditions in terms of precipitation with almost no rainfall, generally receiving 73 mm (2.9 in) annually. Significant seasonal changes in precipitation occur throughout the year. In the wettest month, April it receives low rainfall, averaging 16 mm (0.6 in) of precipitation, recorded across 7 rainy days. In contrast, the driest month July brings less rainfall, with 0 mm (0 in) over 0 rainy days. For more details, please visit our Riyadh Precipitation page.
The mean monthly precipitation over the year, including rain, hail, and snow
The average number of days each month with precipitation
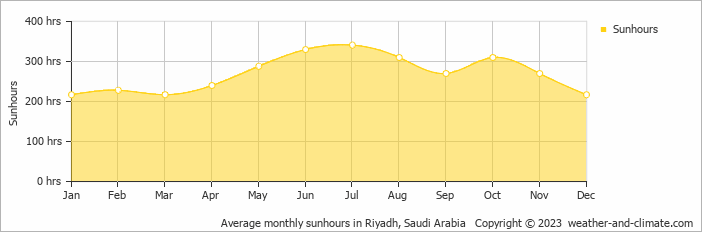
Sunshine Hours in Riyadh
While the amount of sunshine in Riyadh varies throughout the year, all seasons offer their own charm. Enjoy up to 11.4 hours of daily sun in July, and experience slightly darker atmosphere in January, with about 7.2 hours of daily sunlight.
Visit our detailed sunshine hours page for more information.
Monthly hours of sunshine
Daily hours of sunshine
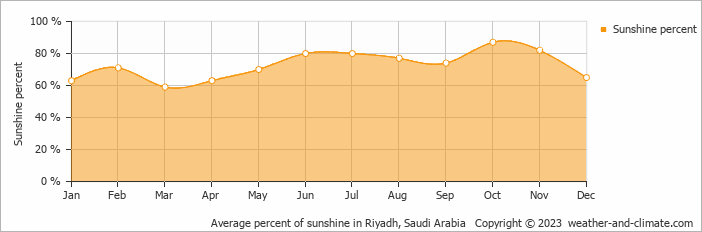
Daily percentage of sunshine
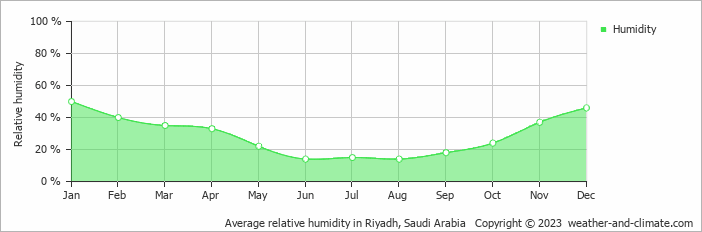
Humidity in Riyadh by Month
The relative humidity is low throughout the year in Riyadh.
The city experiences its highest humidity in January, reaching 50%. In June, the humidity drops to its lowest level at 14%. What does this mean? Read our detailed page on humidity levels for further details.
Relative humidity over the year
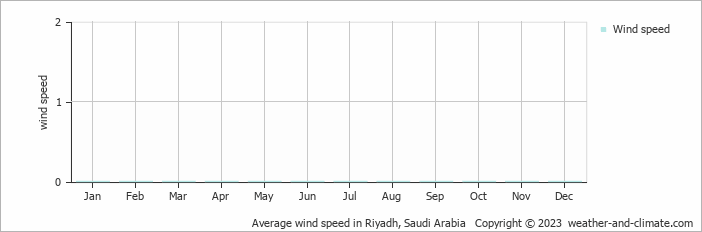
Wind Speed in Riyadh
The mean wind speed over the year ranges from 3 m/s (6 knots) in October to 5 m/s (10 knots) in July. What does this mean?
The mean monthly wind speed over the year (meters per second)
Best Time to Visit Riyadh
Make the most of the clear weather, but remember to protect yourself from the sun and stay well-hydrated. Need help choosing your next travel destination? We offer a specialized tool that matches you with locations based on your weather preferences. Explore destinations that suit your climate preferences.
Frequently asked questions about the climate in Riyadh
What is the best time to visit Riyadh?
January, February, March, November and December typically offer the most optimal weather in Riyadh. In contrast, April, May, June, July, August, September and October tend to have less optimal conditions. Riyadh has a distinct dry season from January to December.
What temperatures can I expect in Riyadh?
Daytime highs range from 22°C (72°F) in January to 45°C (113°F) in July. Nighttime lows range from 9°C (48°F) to 29°C (84°F). Temperatures vary considerably through the year.
How much rain does Riyadh get?
Annual rainfall is around 73 mm (2.9 in). April is the wettest month with 16 mm (0.6 in), while July is the driest with 0 mm (0 in).
How sunny is Riyadh?
Riyadh receives around 3,238 hours of sunshine per year. July is the sunniest month with 341 hours, while January is the cloudiest with just 217 hours. Overall, Riyadh enjoys abundant sunshine.
Riyadh 3-Day Forecast
Riyadh 3-Day Forecast
Riyadh on the map
Riyadh is highlighted — select any city to see its climate.
Popular this month
Where to go in July — average daytime high across popular destinations.