Windhoek Weather & Climate: Best Time to Visit
Average temperatures, rainfall, sunshine and the best time to visit Windhoek.
Climate overview of Windhoek
The climate in Windhoek, Namibia, sees a moderate range of temperatures across the year, from 31°C (88°F) in December down to 22°C (72°F) in July.
The city receives around 540 mm (21 in) of rainfall per year. It experiences a distinct dry season from April to November. February is the wettest month and June the driest. Sunshine peaks in August, when the city sees around 11.4 hours of sunshine per day.
Windhoek Weather by Month
Pick a month to see the average temperature, rainfall and sunshine in Windhoek — and find the best time to visit.
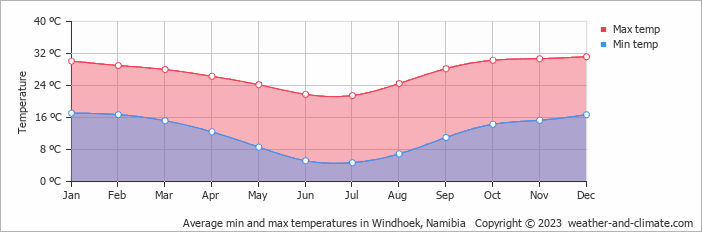
Monthly Temperature in Windhoek
In Windhoek, seasonal changes bring about a moderate variation in temperatures. On average, daytime temperatures range from a very warm 31°C (88°F) in December to a pleasant 22°C (72°F) in July.
Nighttime temperatures range from 17°C (63°F) in December to 5°C (41°F) in July.
Check out our detailed temperature page for more information.
Temperature ranges by month
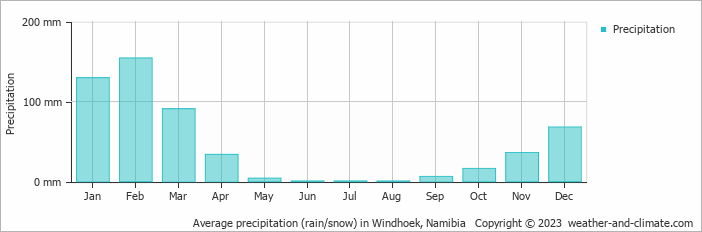
Rainfall in Windhoek
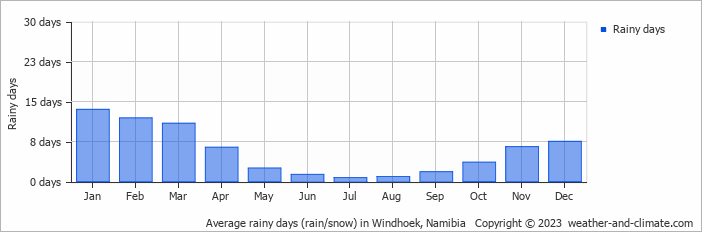
On average, Windhoek receives a reasonable amount of rainfall, with an annual precipitation of 540 mm (21 in). The seasons in Windhoek bring significant changes in precipitation. The wettest month, February, receives high rainfall, with an average of 154 mm (6.1 in) of precipitation. This rainfall is distributed across 12 rainy days.
In contrast, the driest month, June, experiences much less rainfall, totaling 0.5 mm (0.02 in) over a single rainy day. These distinct seasonal differences provide diverse experiences throughout the year. For more details, please visit our Windhoek Precipitation page.
The mean monthly precipitation over the year, including rain, hail, and snow
The average number of days each month with precipitation
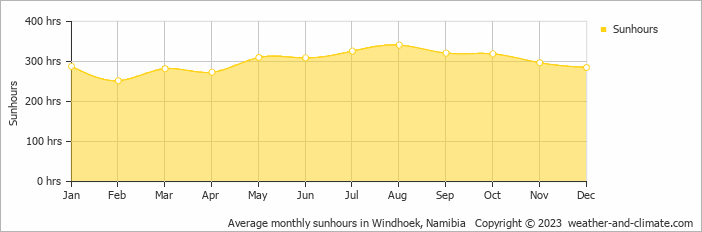
Sunshine Hours in Windhoek
Windhoek enjoys sunny spells year-round. August sees up to 11.4 hours of daily sunshine, perfect for a sunny trip. February, the least sunny month, still offers a generous 8.4 hours of sun despite this cloudier time of the year.
Visit our detailed sunshine hours page for more information.
Monthly hours of sunshine
Daily hours of sunshine
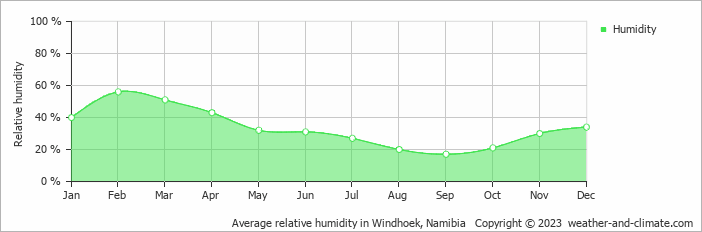
Humidity in Windhoek by Month
The relative humidity is low throughout the year in Windhoek.
The city experiences its highest humidity in February, reaching 56%. In September, the humidity drops to its lowest level at 17%. What does this mean? Read our detailed page on humidity levels for further details.
Relative humidity over the year
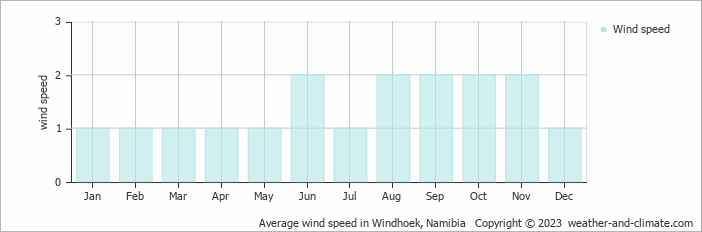
Wind Speed in Windhoek
The average wind speed over the year ranges from 1 m/s (2 knots) to 2 m/s (4 knots). It is lower in January, February, March, April, May, July and December and higher in June, August, September, October and November. What does this mean?
The mean monthly wind speed over the year (meters per second)
Best Time to Visit Windhoek
Frequently asked questions about the climate in Windhoek
What is the best time to visit Windhoek?
March, April, May, June, July, August and September typically offer the most optimal weather in Windhoek. In contrast, January tends to have less optimal conditions. Windhoek has a distinct dry season from April to November.
What temperatures can I expect in Windhoek?
Daytime highs range from 22°C (72°F) in July to 31°C (88°F) in December. Nighttime lows range from 5°C (41°F) to 17°C (63°F).
How much rain does Windhoek get?
Annual rainfall is around 540 mm (21 in). February is the wettest month with 154 mm (6.1 in), while June is the driest with 0.5 mm (0.02 in).
How sunny is Windhoek?
Windhoek receives around 3,603 hours of sunshine per year. August is the sunniest month with 341 hours, while February is the cloudiest with just 252 hours. Overall, Windhoek enjoys abundant sunshine.
Windhoek 3-Day Forecast
Windhoek 3-Day Forecast
Windhoek on the map
Windhoek is highlighted — select any city to see its climate.
Popular this month
Where to go in June — average daytime high across popular destinations.
Bucket list
Need travel inspiration? Check out our bucket list articles and be inspired.