Windhoek Sunshine Hours by Month
Sunshine is key to understanding how a place experiences its seasons. This page shows the total number of hours of direct sunlight per month and the average hours per day in Windhoek, Namibia. These values are calculated using 30 years of data (1990–2020) to ensure accuracy.
Monthly hours of sunshine
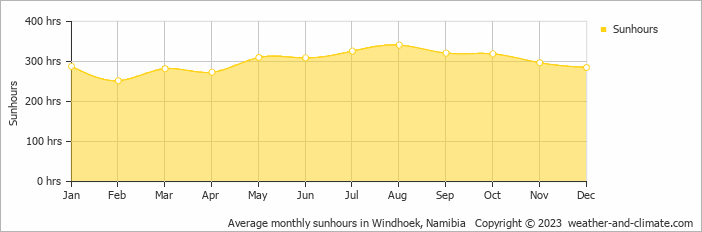
Windhoek experiences sunny spells throughout the year. The sunniest month, August, sees up to 341 hours of sunshine, while February, the least sunny month, still provides a respectable 252 hours. The total annual sunshine amounts to 3603 hours.
Daily hours of sunshine
Enjoy up to 11.4 hours of daily sun in August, and experience slightly darker atmosphere in February, with about 8.4 hours of daily sunlight.
Windhoek vs Major Cities: Sunshine Compared
Windhoek enjoys an average of 3603 hours of sunshine annually. Let’s compare this with some popular tourist destinations:
Seville, Spain, enjoys an impressive 2920 hours of sunshine per year, making it an ideal destination even in winter.
In contrast, Brussels, Belgium, receives only about 1590 hours of sunshine per year, known for its frequently overcast and rainy skies.
Vancouver, Canada, receives approximately 1940 hours of sunshine annually.
In Tokyo, Japan, the average annual sunshine is 1930 hours, with sunny periods between rainy seasons.
Related Climate Data for Windhoek
February, Windhoek’s wettest month, receives 68 mm (2.7 in) of rainfall and has a maximum daytime temperature of 29°C (84°F). During the driest month June you can expect a temperature of 22°C (72°F).
For more detailed insights into the city’s temperatures, check out our Temperature page. To explore more about precipitation patterns, visit our Windhoek Precipitation page.


