Langara Weather & Climate: Best Time to Visit
Temperatures in Langara, Canada, shift moderately through the seasons. The warmest month is August at 16°C (61°F), and the coolest is March at 7°C (45°F).
The city receives considerable rain/snowfall, with around 2079 mm (82 in) annually. October is the wettest month. It has a distinct rainy season from September to February.
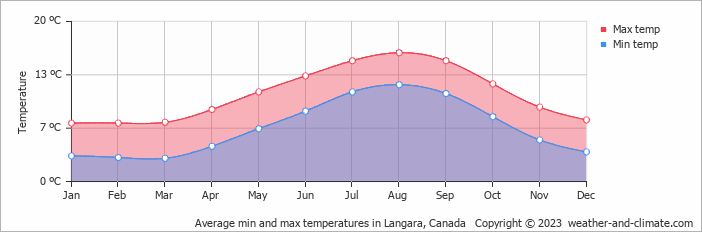
Monthly Temperature in Langara
The climate in Langara experiences moderate temperature changes, with mild shifts between seasons. Typically, average maximum daytime temperatures range from a moderate 16°C (61°F) in August to a chilly 7°C (45°F) in the coolest month, March.
Nights vary from 12°C (54°F) in August to around 3°C (37°F) during the colder months.
Check out our detailed temperature page for more information.
Temperature ranges by month
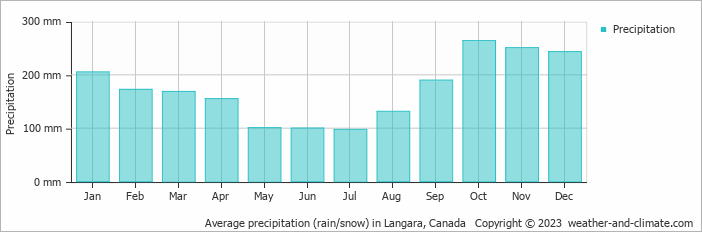
Rainfall in Langara
Langara has a notably wet climate with abundant precipitation, recording 2079 mm (82 in) of rain/snowfall per year. The climate in Langara shows significant variation throughout the year. Expect heavy rainfall in October, the wettest month, with an average of 264 mm (10 in) of precipitation over 26 rainy days.
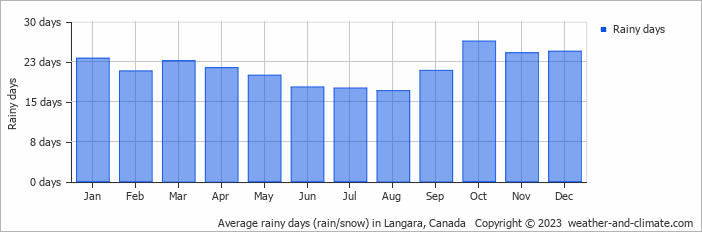
In contrast, the driest month July offers drier and sunnier days, with around 97 mm (3.8 in) of rainfall over 18 rainy days. For more details, please visit our Langara Precipitation page.
The mean monthly precipitation over the year, including rain, hail, and snow
The average number of days each month with precipitation
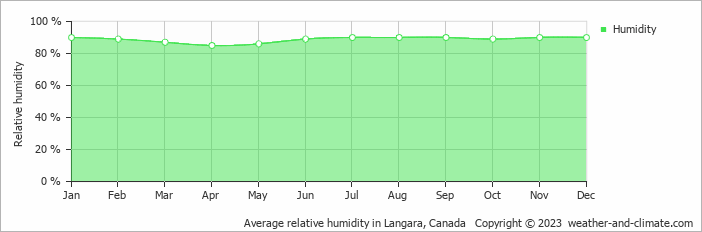
Humidity in Langara by Month
The city experiences its highest humidity in January, reaching 90%. In April, the humidity drops to its lowest level at 85%. What does this mean? Read our detailed page on humidity levels for further details.
Relative humidity over the year
Langara 3-Day Forecast
Check the conditions for any month of the year.
Best Time to Visit Langara
Langara's weather is most enjoyable during August, with comfortable temperatures of 16°C (61°F). The moderate conditions ensure pleasant weather for exploring the area. Expect rainfall of 131 mm (5.2 in) during this period, providing a good balance of sunny and rainy days.The wettest months are January, February, March, September, October, November and December, when precipitation is at its highest. Planning your next adventure but unsure where to go? Our climate tool suggests perfect locations tailored to your preferred weather conditions. Discover your ideal travel destination with our weather planner.


