Burgas Weather & Climate: Best Time to Visit
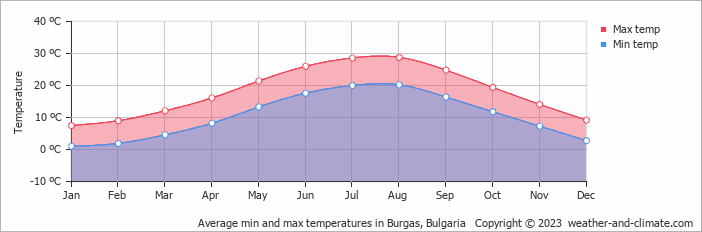
Burgas, Bulgaria, sees big temperature differences between seasons, with August peaking at 29°C (84°F) and January dropping to 8°C (46°F).
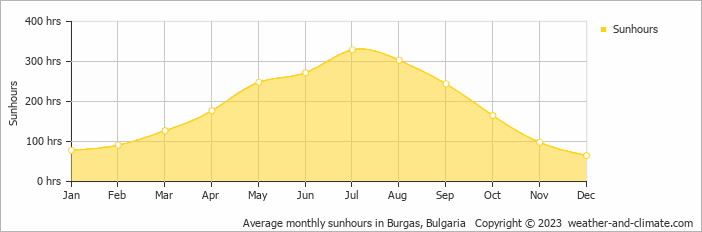
Burgas sees a moderate amount of rain/snowfall, totalling around 659 mm (26 in) per year. The most sunshine falls in July, with an average of 11.0 hours of daily sunshine.
Monthly Temperature in Burgas
Visitors to Burgas can expect significant temperature changes throughout the year. Average maximum daytime temperatures range from a comfortable 29°C (84°F) in August, the warmest time of the year, to a chilly 8°C (46°F) during cooler months like January.
At night, you can expect temperatures ranging from 20°C (68°F) in August to around 1°C (34°F) during January.
Check out our detailed temperature page for more information.
Temperature ranges by month
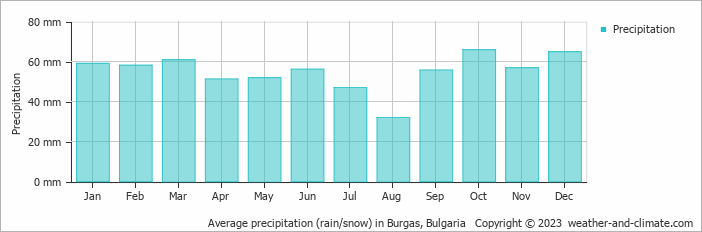
Rainfall in Burgas
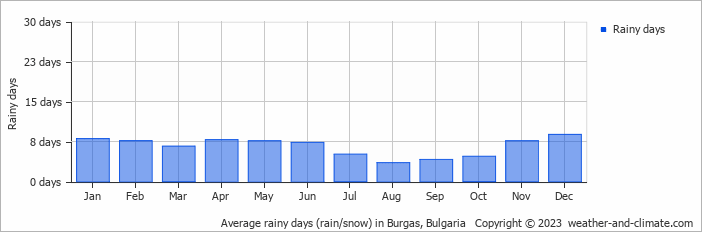
Generally, Burgas experiences moderate precipitation patterns, averaging 659 mm (26 in) yearly. While rainfall varies throughout the year, each season offers its own charm. October brings wetter days averaging 66 mm (2.6 in) of precipitation, spread over 5 rainy days.
In contrast, the driest month August experiences a drier climate, with about 32 mm (1.3 in) of rainfall spread across 4 rainy days. For more details, please visit our Burgas Precipitation page.
The mean monthly precipitation over the year, including rain, hail, and snow
The average number of days each month with precipitation
Sunshine Hours in Burgas
Seasonal changes in sunshine hours are quite dramatic in Burgas. While July receives considerable daily sunshine with up to 11.0 hours, December marks the darkest time of the year, where sunshine is scarce with only 2.2 hours of sunlight per day.
Visit our detailed sunshine hours page for more information.
Monthly hours of sunshine
Daily hours of sunshine
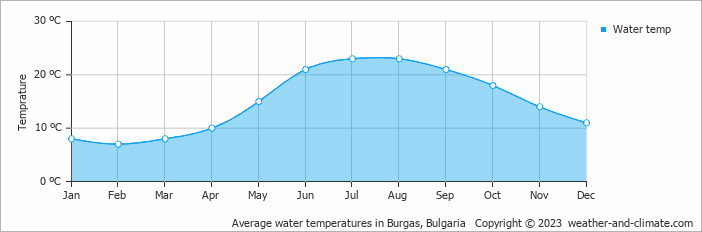
Water Temperature in Burgas
The mean water temperature over the year ranges from 7°C (45°F) in February to 23°C (73°F) in July.
Water temperature over the year
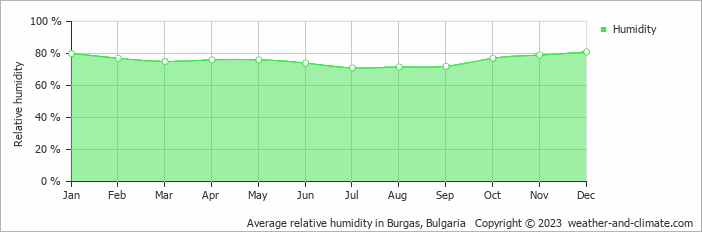
Humidity in Burgas by Month
The relative humidity is high throughout the year in Burgas.
The city experiences its highest humidity in December, reaching 81%. In July, the humidity drops to its lowest level at 71%. What does this mean? Read our detailed page on humidity levels for further details.
Relative humidity over the year
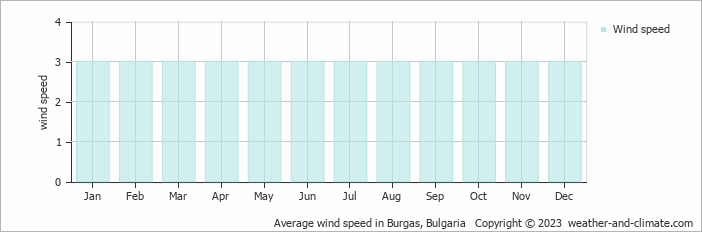
Wind Speed in Burgas
The average wind speed over the year ranges from 3 m/s (6 knots) to 3 m/s (6 knots). It is lower in January, February, March, April, May, June, July, August, September, October, November and December and higher in January, February, March, April, May, June, July, August, September, October, November and December. What does this mean?
The mean monthly wind speed over the year (meters per second)
Burgas 3-Day Forecast
Check the conditions for any month of the year.
Best Time to Visit Burgas
During May, June, July, August, September and October, Burgas experiences its most favorable weather, with temperatures between 19°C (67°F) and 29°C (84°F). These mild conditions make it an excellent time for a visit.The weather does bring rainfall during this period, between 32 mm (1.3 in) and 66 mm (2.6 in). Looking for inspiration on where to travel this year? We have a tool that recommends destinations based on your ideal conditions. Find out where to go with our weather planner.