















 Discover Kok Kood: a hidden gem in Thailand
Discover the hidden gem of Thailand - Koh Kood! Explore stunning beaches, waterfalls and eco-friendly resorts while enjoying a peaceful atmosphere away from the crowds.
On this page you find more information about the monthly relative humidity over the year in Thong Nai Pan Yai (Surat Thani Province), Thailand.
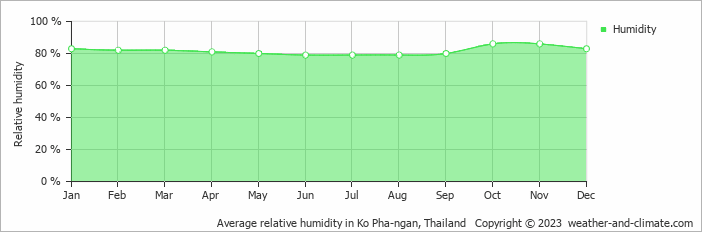
Thong Nai Pan Yai's humidity levels vary throughout the year. The highest levels occur in October, reaching 86% (very high), while the lowest is recorded in June at 79%.
Throughout the year, the average humidity in Thong Nai Pan Yai is 82%.
Humidity plays an important role in how temperatures are felt. During the warmest month, May, the maximum average temperature is around 31°C (88°F). Combined with very high humidity during this period, the temperature can feel even warmer than the thermometer shows.
During the coldest month, January, the maximum average temperature is around 29°C (84°F). This period has very high humidity. Check out our detailed temperature page for more information.
Pick a month to see the average temperature, rainfall and sunshine in Thong Nai Pan Yai - and find the best time to visit.
Temperature Rainfall Sunshine Humidity
See the full Thong Nai Pan Yai climate overview or explore weather in Thailand.
Where to go in October - average daytime high across popular destinations.
Bangkok 33°C (91°F) Chiang Mai
 32°C (90°F) Jomtien Beach32°C (90°F) Ao Nang Beach30°C (86°F) Hua Hin31°C (88°F) Patong Beach29°C (84°F) Ko Lanta29°C (84°F)
 Need travel inspiration? Check out our bucket list articles and be inspired.
Discover Kok Kood: a hidden gem in Thailand
Discover the hidden gem of Thailand - Koh Kood! Explore stunning beaches, waterfalls and eco-friendly resorts while enjoying a peaceful atmosphere away from the crowds.

 Warm Days, Cool Nights: 8 Destinations With the Perfect Day-Night Temperature
Prefer warm sunny days but cool evenings? Compare eight destinations with daytime temperatures of around 25–30°C, cooler nights, low rainfall and plenty of sunshine.

 Where to Travel in July and August: Mexico, Thailand, Indonesia or Somewhere Else?
Compare July and August weather in Mexico, Thailand, Indonesia, Zanzibar and Sri Lanka, using historical climate data for temperature, rainfall and sunshine.
 Discover Thailand: An Ultimate Guide for Yogis
Explore Thailand's best for yogis: serene retreats, spiritual growth, and adventure. Dive into yoga, meditation, and nature's tranquility for an unforgettable journey.