Average humidity in Gabbro
On this page you find more information about the monthly relative humidity over the year in Gabbro (), Italy.
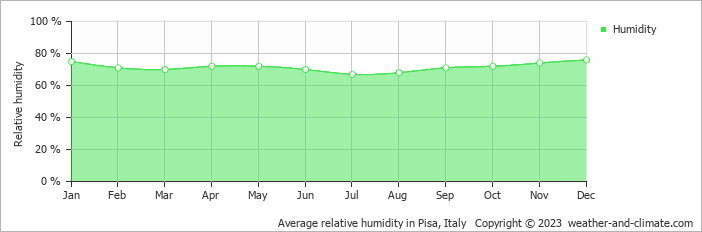
Gabbro's humidity levels vary throughout the year. The highest levels occur in December, reaching 76% (high), while the lowest is recorded in July at 67%.
Throughout the year, the average humidity in Gabbro is 72%.
Humidity plays an important role in how temperatures are felt. During the warmest month, August, the maximum average temperature is around 29°C (84°F). Combined with high humidity during this period, the temperature can feel even warmer than the thermometer shows.
During the coldest month, January, the maximum average temperature is around 12°C (54°F). This period has high humidity. Check out our detailed temperature page for more information.


