


















 The 10 most beautiful historical towns in Italy
Discover Italy's top 10 historic towns, featuring breathtaking medieval architecture and deep-rooted history, ideal for enthusiasts of extraordinary cities.
On this page you find more information about the monthly relative humidity over the year in Cavi di Lavagna (Liguria), Italy.
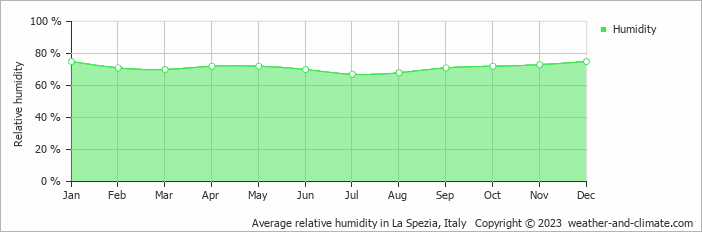
Cavi di Lavagna's humidity levels vary throughout the year. The highest levels occur in January, reaching 75% (high), while the lowest is recorded in July at 67%.
Throughout the year, the average humidity in Cavi di Lavagna is 71%.
Humidity plays an important role in how temperatures are felt. During the warmest month, August, the maximum average temperature is around 26°C (79°F). Combined with high humidity during this period, the temperature can feel even warmer than the thermometer shows.
During the coldest month, January, the maximum average temperature is around 11°C (52°F). This period has high humidity. Check out our detailed temperature page for more information.
Pick a month to see the average temperature, rainfall and sunshine in Cavi di Lavagna - and find the best time to visit.
Temperature Rainfall Sunshine Humidity
See the full Cavi di Lavagna climate overview or explore weather in Italy.
Where to go in October - average daytime high across popular destinations.
Need travel inspiration? Check out our bucket list articles and be inspired.
The 10 most beautiful historical towns in Italy
Discover Italy's top 10 historic towns, featuring breathtaking medieval architecture and deep-rooted history, ideal for enthusiasts of extraordinary cities.
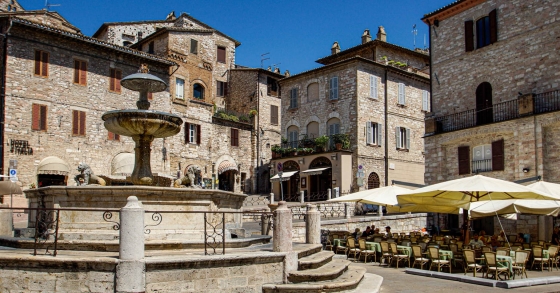 Experience mystical Assisi
Assisi is the most famous town in Umbria and best known because of Saints Francis and Clare of Assisi. Many visitors come to see the breathtaking San Francesco basilica.
 The Battle of Oranges
This is one of the most unusual festivals in Italy. The festival is held in the middle of winter during the winter carnival. The entire city of Ivrea near Turin turns into a battlefield.
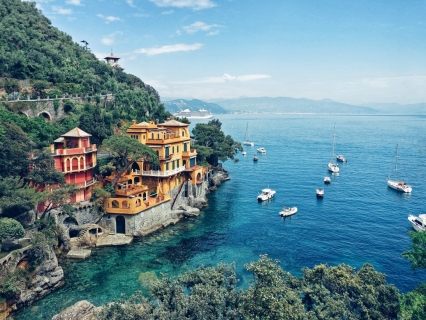 The most beautiful fishing village of Italy
Portofino is the most beautiful fishing village in Italy and maybe even in the world. We absolutely recommend that you add this beautiful place to your bucket list.