Average monthly water temperature in Saint-Joseph, Martinique
On this page you find the mean water temperature over the year in Saint-Joseph (), Martinique. Dive into the water temperature trends, highlighting the best times for swimming and other activities.
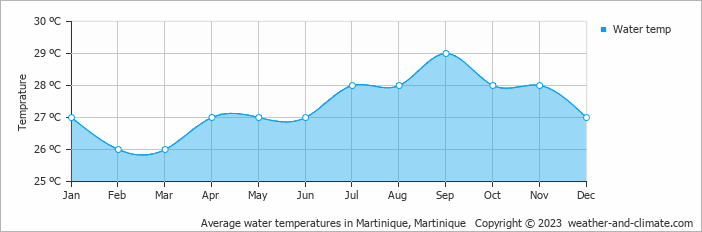
Data from: Martinique, Martinique (8 KM, 5 Miles).
In Saint-Joseph, water remains inviting throughout the year. The warmest month is September, with an average water temperature of 29°C (84°F).
The coolest temperature, March, still averages a pleasant 26°C (79°F). This means you will have a consistently enjoyable environment for water activities and recreation.


