Saint-Joseph Weather & Climate: Best Time to Visit
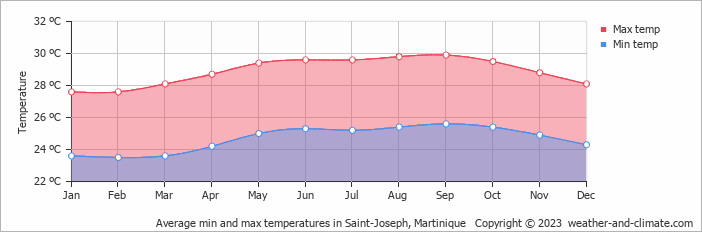
With consistently stable weather, Saint-Joseph, Martinique, sees little seasonal temperature change. Daytime highs average 29°C (84°F), ranging from 30°C (86°F) in September to 28°C (82°F) in February.
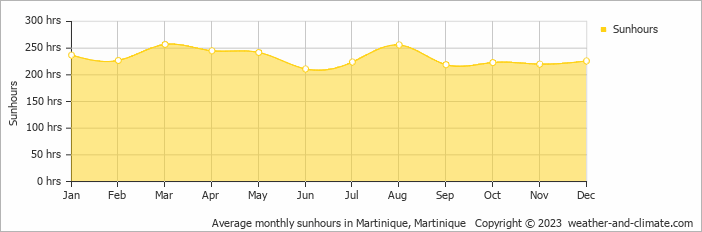
The city has a wet climate, receiving around 1087 mm (43 in) of rainfall per year. October is the wettest month. The sunniest month is March, with 8.6 hours of sunshine per day on average.
Monthly Temperature in Saint-Joseph
The climate in Saint-Joseph remains fairly constant, offering comfortable temperatures throughout the year. On average, daytime temperatures range from a comfortable 30°C (86°F) in September to a comfortable 28°C (82°F) in February.
Nighttime temperatures range from 26°C (79°F) in September to 24°C (75°F) in February.
Check out our detailed temperature page for more information.
Temperature ranges by month
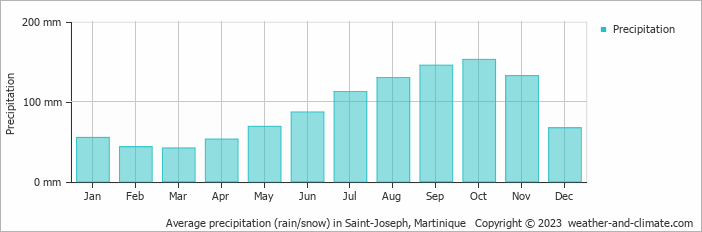
Rainfall in Saint-Joseph
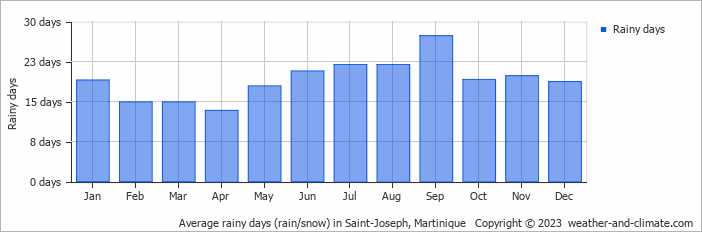
Saint-Joseph is known for its substantial rainfall, with annual precipitation reaching 1087 mm (43 in). The seasons in Saint-Joseph bring significant changes in precipitation. The wettest month, October, receives high rainfall, with an average of 152 mm (6 in) of precipitation. This rainfall is distributed across 19 rainy days.
In contrast, the driest month, March, experiences much less rainfall, totaling 42 mm (1.7 in) over 15 rainy days. These distinct seasonal differences provide diverse experiences throughout the year. For more details, please visit our Saint-Joseph Precipitation page.
The mean monthly precipitation over the year, including rain, hail, and snow
The average number of days each month with precipitation
Sunshine Hours in Saint-Joseph
The sunniest days in Saint-Joseph occur in March, with around 8.6 hours of daily sunshine. Even in June, the least sunny month, Saint-Joseph doesn't shy away from the sun, still enjoying a comfortable 7.0 hours of daily sunlight.
Visit our detailed sunshine hours page for more information.
Monthly hours of sunshine
Daily hours of sunshine
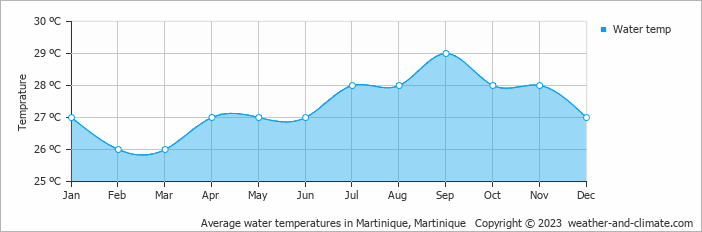
Water Temperature in Saint-Joseph
The mean water temperature over the year ranges from 26°C (79°F) in February to 29°C (84°F) in September.
Water temperature over the year
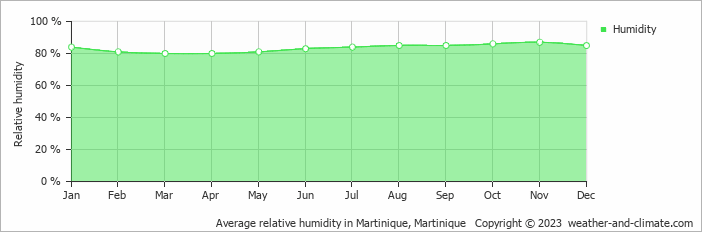
Humidity in Saint-Joseph by Month
The city experiences its highest humidity in November, reaching 87%. In March, the humidity drops to its lowest level at 80%. What does this mean? Read our detailed page on humidity levels for further details.
Relative humidity over the year
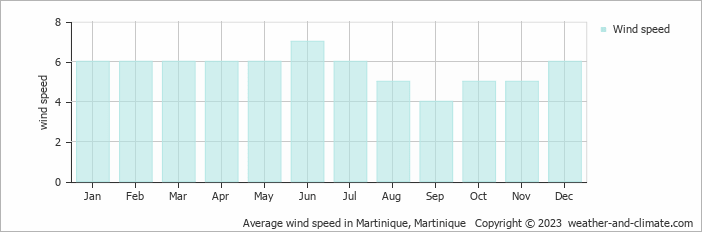
Wind Speed in Saint-Joseph
The average wind speed over the year ranges from 4 m/s (8 knots) to 7 m/s (14 knots). It is lower in September and higher in June. What does this mean?
The mean monthly wind speed over the year (meters per second)
Saint-Joseph 3-Day Forecast
Check the conditions for any month of the year.
Best Time to Visit Saint-Joseph
In general, temperatures in Saint-Joseph range from 28°C (82°F) to 30°C (86°F) across the year, with February, March and April being the best time to visit for those who prefer drier weather.Make your experience more enjoyable by planning to be outside during the cooler parts of the day, either early morning or as the sun begins to set. Looking for inspiration on where to travel this year? We have a tool that recommends destinations based on your ideal conditions. Find out where to go with our weather planner.


