ClimateForecastAprilMay >>

Climate in Qamea, Fiji

The graphs below show the monthly weather averages over the year.

Average day and night temperature

The mean minimum and maximum temperatures over the year.

Average monthly minimum and maximum temperature in Qamea, Fiji

Feel free to add this climate graph to your website. Click the copy button above.

Monthly precipitation

The mean monthly precipitation over the year, including rain, snow, hail etc.

Average monthly rainfall, snow, precipitation in Qamea, Fiji

Feel free to add this climate graph to your website. Click the copy button above.

Monthly rainy days

The average number of days each month with rain, snow, hail etc.

Average monthly rainy days in Qamea, Fiji

Feel free to add this climate graph to your website. Click the copy button above.

Weather Forecasts for Qamea

Fri   Apr 19
30°C | 25°C
E 32 km/h
1.8 mm
broken clouds and slight rain

broken clouds and slight rain

Sat   Apr 20
30°C | 25°C
E 29 km/h
4.6 mm
partly cloudy and rain

partly cloudy and rain

Sun   Apr 21
30°C | 24°C
SE 25 km/h
4.9 mm
partly cloudy and rain

partly cloudy and rain

The best time of year to visit Qamea in Fiji

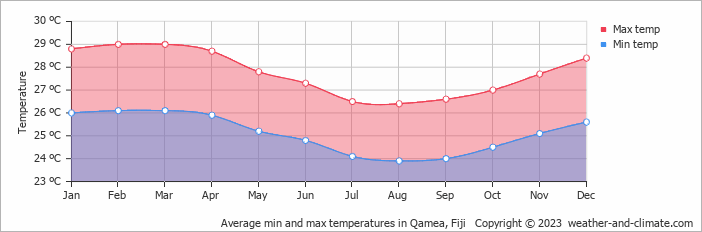
Qamea has high temperatures year round ranging between 26°C and 29°C.
Other facts from our historical weather data:

  • Which is the warmest month in Qamea?
    March has an average maximum temperature of 29°C and is the warmest month of the year.
  • Which is the coldest month in Qamea?
    The coldest month is August with an average maximum temperature of 26°C.
  • Which is the wettest month in Qamea?
    January tops the wettest month list with 282 mm of rainfall.
  • Which is the driest month in Qamea?
    July is the driest month with 77 mm of precipitation.

  • No idea where to travel to this year? We have a tool that recommends destinations based on your ideal conditions. Find out where to go with our weather planner.