Average monthly water temperature in Le Robert, Martinique
On this page you find the mean water temperature over the year in Le Robert (), Martinique. Get insights into the water temperature fluctuations and discover what they mean for visitors.
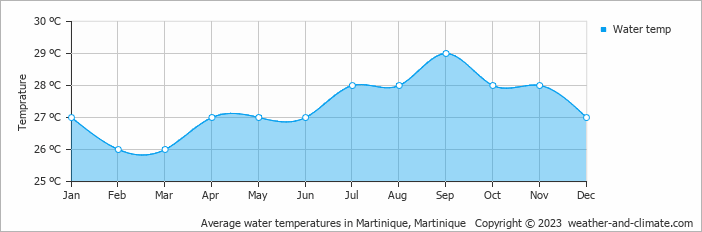
Data from: Martinique, Martinique (10 KM, 6 Miles).
In Le Robert, water temperatures are consistently warm throughout the year. The warmest month is September, with an average water temperature of 29°C (84°F).
The coolest month is March, with an average temperature of 26°C (79°F). This makes Le Robert a year-round destination for swimming and other water-based activities.


