Le Robert Weather & Climate: Best Time to Visit
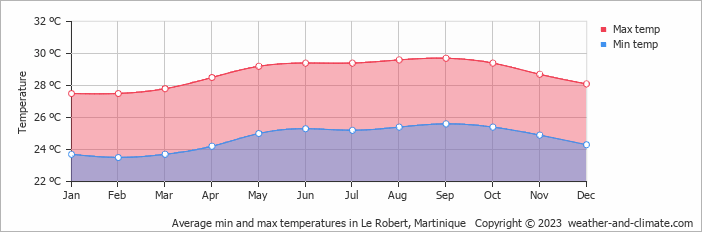
The climate in Le Robert, Martinique, is remarkably consistent, with temperatures year-round averaging 29°C (84°F). The warmest month is September at 30°C (86°F), and the coolest is February at 28°C (82°F).
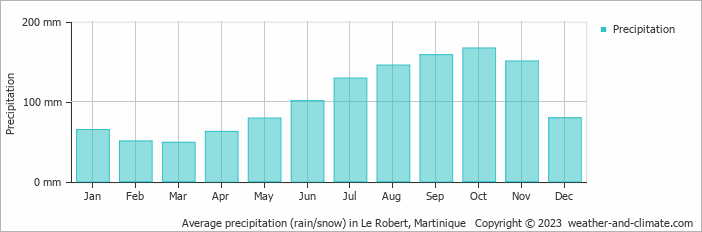
The city has a wet climate, receiving around 1236 mm (49 in) of rainfall per year. October is the wettest month. Sunshine peaks in March, when the city sees around 8.6 hours of sunshine per day.
Monthly Temperature in Le Robert
In Le Robert temperatures are generally consistent throughout the year. On average, daytime temperatures range from a comfortable 30°C (86°F) in September to a comfortable 28°C (82°F) in February.
Nighttime temperatures range from 26°C (79°F) in September to 24°C (75°F) in February.
Check out our detailed temperature page for more information.
Temperature ranges by month
Rainfall in Le Robert
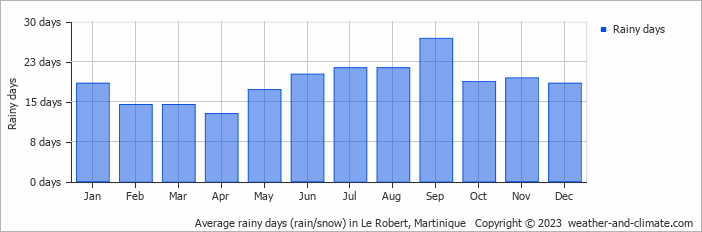
Le Robert experiences significant rainfall throughout the year, averaging 1236 mm (49 in) of precipitation annually. The seasons in Le Robert bring significant changes in precipitation. The wettest month, October, receives heavy rainfall, with an average of 167 mm (6.6 in) of precipitation. This rainfall is distributed across 19 rainy days.
In contrast, the driest month, March, experiences much less rainfall, totaling 49 mm (1.9 in) over 14 rainy days. These distinct seasonal differences provide diverse experiences throughout the year. For more details, please visit our Le Robert Precipitation page.
The mean monthly precipitation over the year, including rain, hail, and snow
The average number of days each month with precipitation
Sunshine Hours in Le Robert
The sunniest days in Le Robert occur in March, with around 8.6 hours of daily sunshine. Even in June, the least sunny month, Le Robert doesn't shy away from the sun, still enjoying a comfortable 7.0 hours of daily sunlight.
Visit our detailed sunshine hours page for more information.
Monthly hours of sunshine
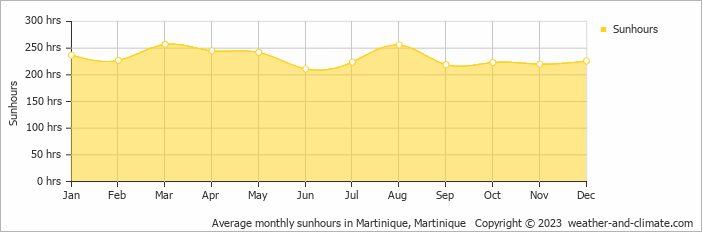
Daily hours of sunshine
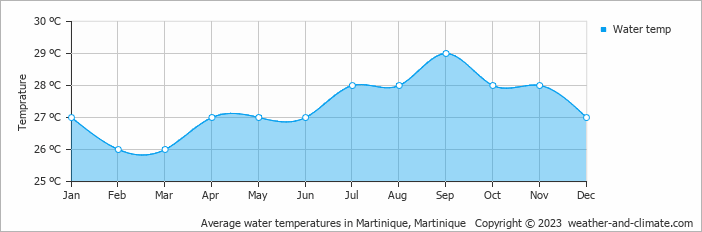
Water Temperature in Le Robert
The mean water temperature over the year ranges from 26°C (79°F) in February to 29°C (84°F) in September.
Water temperature over the year
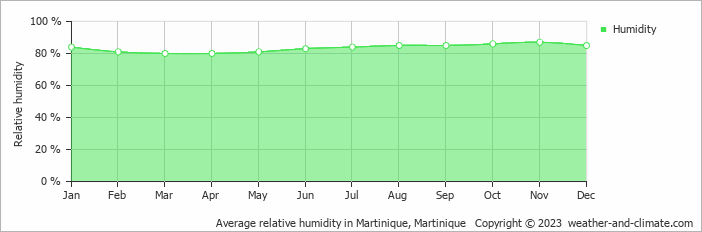
Humidity in Le Robert by Month
The city experiences its highest humidity in November, reaching 87%. In March, the humidity drops to its lowest level at 80%. What does this mean? Read our detailed page on humidity levels for further details.
Relative humidity over the year
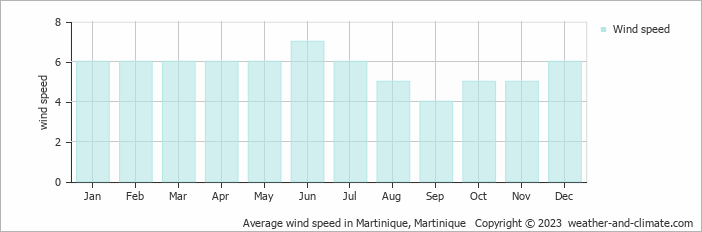
Wind Speed in Le Robert
The mean wind speed varies between 4 m/s (8 knots) and 7 m/s (14 knots) throughout the year. It is lowest in September and highest during June. What does this mean?
The mean monthly wind speed over the year (meters per second)
Le Robert 3-Day Forecast
Check the conditions for any month of the year.
Best Time to Visit Le Robert
The warm weather in Le Robert maintains temperatures between 28°C (82°F) and 30°C (86°F) year-round. Plan your visit during February and March for drier days and the best conditions to enjoy being outside.To make the most of your visit, consider exploring early in the morning or during the pleasant late afternoon hours when the temperature is most comfortable.
Be aware that October has significant precipitation. Seeking the perfect travel destination for this year? We've created a tool that suggests locations matching your desired weather. Let our weather planner guide your travel decisions.


