
















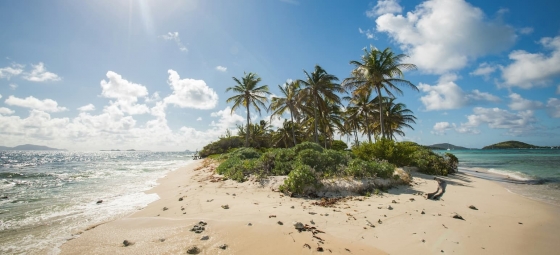
 10 Hidden gems in Asia you need to visit
Explore 10 hidden gems in Asia offering authentic experiences, from pristine beaches and remote islands to cultural treks and peaceful mountain villages.
On this page you find the mean water temperature over the year in Al Khor (Al Khor), Qatar. Get insights into the water temperature fluctuations and discover what they mean for visitors.

In Al Khor, water temperatures vary throughout the year. The warmest month is August, with an average water temperature of 34°C (93°F).
The coldest month is February, with an average temperature of 19°C (66°F). These seasonal variations make Al Khor a great destination for different kinds of aquatic activities.
Pick a month to see the average temperature, rainfall and sunshine in Al Khor - and find the best time to visit.
Temperature Rainfall Sunshine Humidity Water Temp
See the full Al Khor climate overview or explore weather in Qatar.
Where to go in November - average daytime high across popular destinations.
Need travel inspiration? Check out our bucket list articles and be inspired.
10 Hidden gems in Asia you need to visit
Explore 10 hidden gems in Asia offering authentic experiences, from pristine beaches and remote islands to cultural treks and peaceful mountain villages.

 Chase the autumn leaves in Japan
Japan is one of these cases which turns into a gold, yellow and orange fairy tale starting from September. And we can honestly say: We cannot imagine a more beautiful season to visit Japan.

 The 10 Most Exquisite Beaches in the Philippines
Explore the top 10 breathtaking beaches in the Philippines, from serene Nacpan Beach to volcanic Camiguin Island, in our detailed guide.
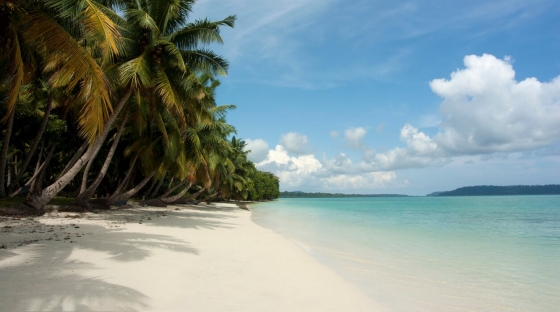
 A paradise called Andaman Islands
Though officially Indian, the Andamans are nearer Myanmar, Indonesia, and Thailand, resulting in amazing, budget-friendly white-sand beaches.