

















 10 Hidden gems in Asia you need to visit
Explore 10 hidden gems in Asia offering authentic experiences, from pristine beaches and remote islands to cultural treks and peaceful mountain villages.
Average temperatures, rainfall, sunshine and the best time to visit Al Khor.
 –
–
Pick a month to see the average temperature, rainfall and sunshine in Al Khor - and find the best time to visit.
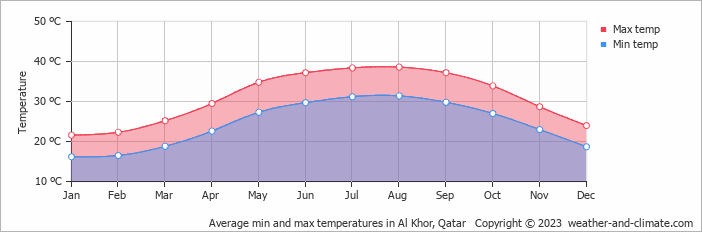
Depending on the time of the year, temperatures range from very hot to pleasant in Al Khor. Average daytime temperatures reach a very hot 39°C (102°F) in August. In January, the coolest month of the year, temperatures drop to a pleasant 22°C (72°F).
At night, temperatures range from around 31°C (88°F) in August to 16°C (61°F) in January.
Check out our detailed temperature page for more information.
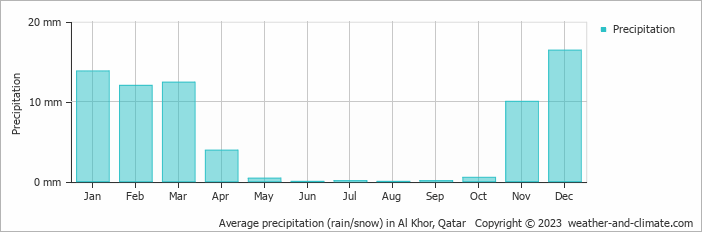
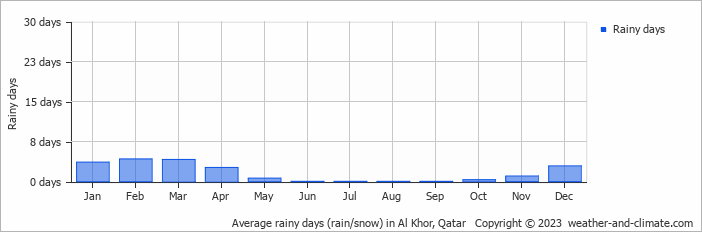
Al Khor has a dry climate with very low precipitation, averaging 70 mm (2.8 in) of rainfall annually. Al Khor can be quite wet during December, receiving approximately 16 mm (0.6 in) of precipitation over 3 rainy days.
In contrast, during the driest month (June), you will experience much drier conditions, with 0 mm (0 in) of precipitation spread across 0 rainy days. For more details, please visit our Al Khor Precipitation page.
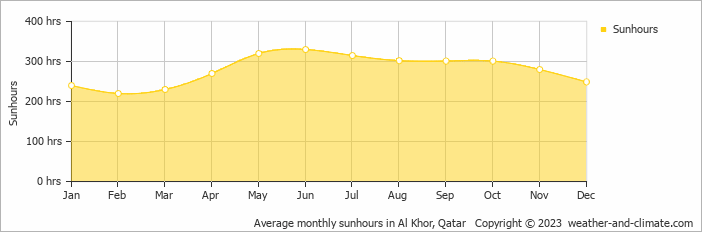
Al Khor experiences moderate variation in sunshine hours across the seasons. With 11.0 hours daily sunshine in June, it dips to 7.3 hours in February, offering a balanced mix of sunny and overcast days.
Visit our detailed sunshine hours page for more information.
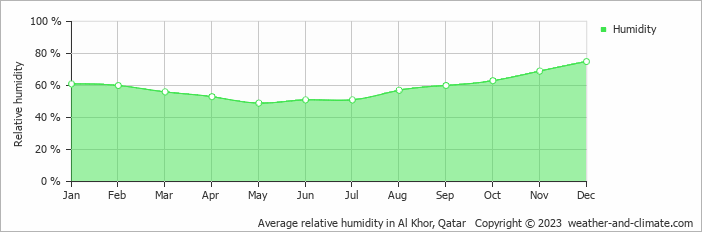
The relative humidity is moderate throughout the year in Al Khor.
The city experiences its highest humidity in December, reaching 75%. In May, the humidity drops to its lowest level at 49%. What does this mean? Read our detailed page on humidity levels for further details.
Monthly ratings reflect general weather comfort, based on daytime temperature and rainfall. Swimming and winter conditions are highlighted separately where relevant.
January, February, March, November and December typically offer the most optimal weather in Al Khor. In contrast, May, June, July, August, September and October tend to have less optimal conditions. Al Khor has very little rainfall year-round, with very hot summers and pleasant winters.
Daytime highs range from 22°C (72°F) in January to 39°C (102°F) in August. Nighttime lows range from 16°C (61°F) to 31°C (88°F). Temperatures vary considerably through the year.
Annual rainfall is around 70 mm (2.8 in). December is the wettest month with 16 mm (0.6 in), while June is the driest with 0 mm (0 in).
Al Khor receives around 3,358 hours of sunshine per year. June is the sunniest month with 330 hours, while February is the cloudiest with just 220 hours. Overall, Al Khor enjoys abundant sunshine.
Al Khor is highlighted - select any city to see its climate.
Where to go in September - average daytime high across popular destinations.
Need travel inspiration? Check out our bucket list articles and be inspired.
10 Hidden gems in Asia you need to visit
Explore 10 hidden gems in Asia offering authentic experiences, from pristine beaches and remote islands to cultural treks and peaceful mountain villages.

 Chase the autumn leaves in Japan
Japan is one of these cases which turns into a gold, yellow and orange fairy tale starting from September. And we can honestly say: We cannot imagine a more beautiful season to visit Japan.

 The 10 Most Exquisite Beaches in the Philippines
Explore the top 10 breathtaking beaches in the Philippines, from serene Nacpan Beach to volcanic Camiguin Island, in our detailed guide.

 A paradise called Andaman Islands
Though officially Indian, the Andamans are nearer Myanmar, Indonesia, and Thailand, resulting in amazing, budget-friendly white-sand beaches.