
















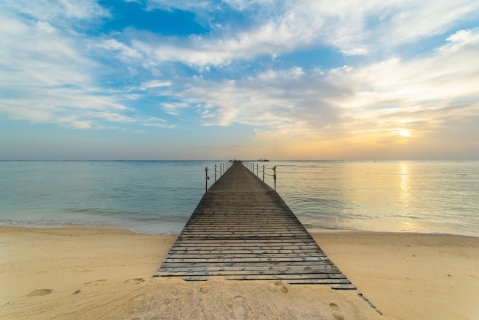
 Where to Go for Christmas: Sun, Value and Fewer Crowds
Where can you find warm Christmas weather without peak-season prices and huge crowds? Compare Marsa Alam, The Gambia, Vietnam, Agadir and Cap Skirring.
On this page you find the mean water temperature over the year in Ain El Sokhna (), Egypt. Get insights into the water temperature fluctuations and discover what they mean for visitors.
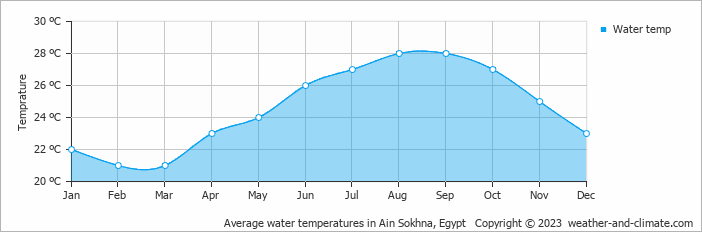
In Ain El Sokhna, water remains inviting throughout the year. The warmest month is August, with an average water temperature of 28°C (82°F).
The coolest temperature, February, still averages a pleasant 21°C (70°F). This means you will have a consistently enjoyable environment for water activities and recreation.
Pick a month to see the average temperature, rainfall and sunshine in Ain El Sokhna - and find the best time to visit.
Temperature Rainfall Water Temp
See the full Ain El Sokhna climate overview or explore weather in Egypt.
Where to go in October - average daytime high across popular destinations.
Need travel inspiration? Check out our bucket list articles and be inspired.
Where to Go for Christmas: Sun, Value and Fewer Crowds
Where can you find warm Christmas weather without peak-season prices and huge crowds? Compare Marsa Alam, The Gambia, Vietnam, Agadir and Cap Skirring.
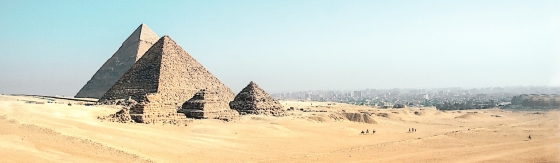 The Pyramids of Giza are impressive and absolutely worth a visit
The pyramids are considered to be one of the seven wonders of the world in ancient times and they are the only one that still exist and can be visited today.
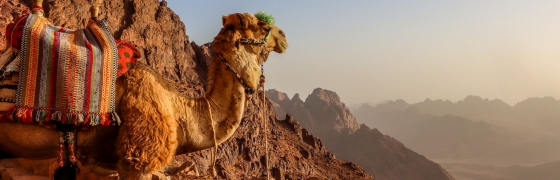 The Sinai Peninsula: Nowhere on earth is as quiet as this place
The Sinai Peninsula has an extraordinary and enchanting landscape. The peace and space in this region is overwhelming. Nowhere on earth is as quiet as this place.
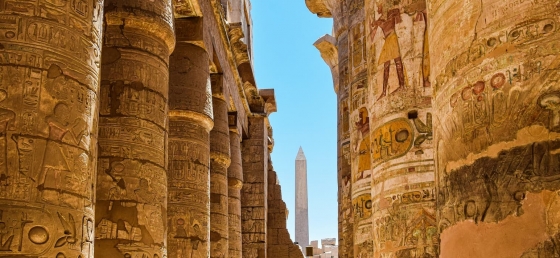 The Timeless Wonders of Luxor
Discover Luxor’s ancient marvels, from the grand Karnak temple and royal tombs of Thebes to the historic charm of the Old Winter Palace.