
















 Explore the Majestic Copper Canyons of Mexico
Explore the vast Copper Canyons in Chihuahua, Mexico—larger than the Grand Canyon. Discover scenic train rides, hikes, and the Tarahumara people.
This page shows both the average monthly rainfall and the number of rainy days in Zamora de Hidalgo, Michoacan, Mexico. The figures are based on a 30-year period (1990–2020) to provide a reliable average. Now, let's explore all the details to give you a full picture.
Zamora de Hidalgo is known for its substantial rainfall, with annual precipitation reaching 1284 mm (51 in). While the overall climate is wet, there are notable seasonal patterns that create interesting contrasts, as demonstrated in our graph below.
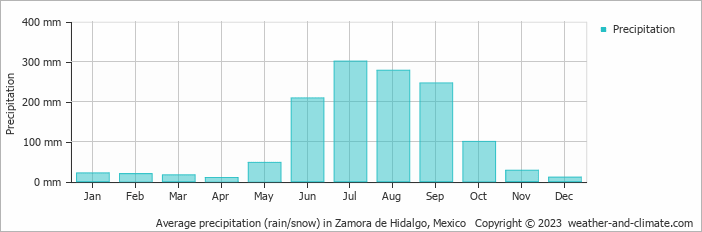
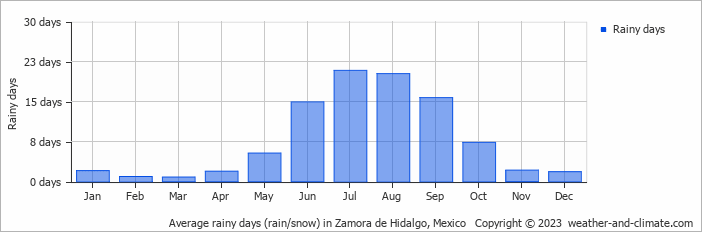
Zamora de Hidalgo can be quite wet during July, receiving approximately 301 mm (12 in) of precipitation over 21 rainy days.
In contrast April, experiences much drier conditions, with 9.5 mm (0.4 in) of rainfall, spread across 2 rainy days.
July, the wettest month, has a maximum daytime temperature of 27°C (81°F). During the driest month April you can expect a temperature of 31°C (88°F). For more detailed insights into the city's temperatures, visit our Zamora de Hidalgo Temperature page.
The map below shows the annual precipitation across Mexico. You can also select the different months in case you are interested in a specific month.
Zamora de Hidalgo's average annual precipitation is 1284 mm (51 in). Let's compare this to some popular worldwide tourist destinations:
The climate in San Francisco, USA, is influenced by coastal weather, with 469 mm (18 in) of rainfall mostly during the winter months.
Osaka, Japan, experiences 1507 mm (59 in) of rainfall annually, spread across the year with wetter summers.
Adelaide, Australia, enjoys 511 mm (20 in) of annual precipitation, with dry summers and wet winters.
Singapore, situated near the equator, gets 2581 mm (102 in) of rainfall annually, with no distinct dry season and consistent monthly precipitation.
Precipitation amounts are measured using specific gauges installed at weather stations, collecting both rain and snow and any other type of precipitation. Rainfall is measured directly in millimeters, while that from snow and ice is obtained by melting it. Automated systems often incorporate heaters to make this easier.
Information from these stations is transmitted via Wi-Fi, satellite, GPS, or telephone connections to central monitoring networks. This information is immediately updated and integrated into weather models and forecasts.
For more detailed information about Zamora de Hidalgo's weather, including sunshine hours, humidity levels, and temperature data, visit our Zamora de Hidalgo Climate page.
Pick a month to see the average temperature, rainfall and sunshine in Zamora de Hidalgo - and find the best time to visit.
Temperature Rainfall
See the full Zamora de Hidalgo climate overview or explore weather in Mexico.
Where to go in September - average daytime high across popular destinations.
Puerto Peñasco 34°C (93°F) Los Cabos
 32°C (90°F) Tulum31°C (88°F) Cancún30°C (86°F) Playa del Carmen31°C (88°F) Puerto Vallarta29°C (84°F) San Miguel de Allende
 27°C (81°F) Mexico City23°C (73°F)
 Need travel inspiration? Check out our bucket list articles and be inspired.
Explore the Majestic Copper Canyons of Mexico
Explore the vast Copper Canyons in Chihuahua, Mexico—larger than the Grand Canyon. Discover scenic train rides, hikes, and the Tarahumara people.
 These are the most beautiful Mayan ruins and Mayan temples in Mexico
Mexico is a destination where you can immerse yourself in ancient cultures and civilizations. In this article we have listed our favorite Mayan ruins.
 Tips, to-do's and nicest restaurants in Mexico City
Mexico City, one of the most famous and notorious cities of the world. The best time to visit is between March and May, but it can be visited year round.
 Zihuatanejo: A Pacific paradise with beautiful beaches
Zihuatanejo has some of Mexico's top beaches. Unlike other off-the-beaten-path destinations in Mexico, Zihua is very accessible and sustainable.