Valfurva Rainfall & Precipitation: Monthly Averages and Year-Round Insights
This page shows the average amount of rainfall per month in Valfurva. The numbers are calculated over a 30-year period to provide a reliable average. Let’s explore the details in depth to provide you with a complete overview.
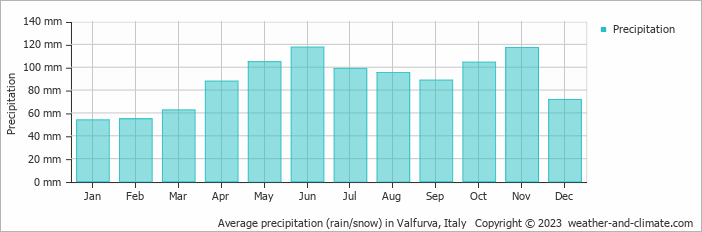
Valfurva has a notably wet climate with abundant precipitation, recording 1057 mm of rain/snowfall per year.
Monthly Precipitation Levels
The average number of days each month with precipitation (> 0.2 mm)
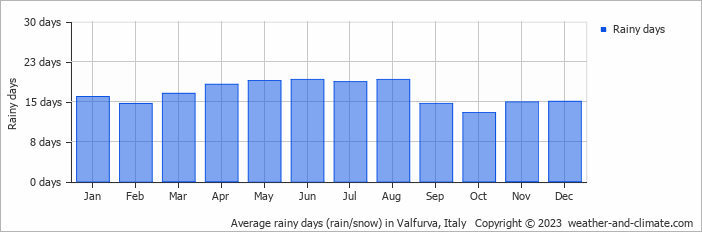
Significant seasonal changes in precipitation occur throughout the year. During the wet season, June receives substantial rainfall, averaging 118 mm of precipitation, recorded across 19 rainy days.
In contrast, the drier season, January brings less snowfall, with 54 mm over 16 snowy days.June, the wettest month, has a maximum daytime temperature of 13°C. The city receives 188 hours of sunshine in this period. During the driest month January you can expect a temperature of -6°C. For more detailed insights into the city’s temperatures, visit our Valfurva Temperature page.
Annual Precipitation in Italy
The map below shows the annual precipitation across Italy. You can also select the different months in case you are interested in a specific month.


 heavy rainfall
 high
high
 moderate
 low
low
 almost none
Amsterdam Precipitation Compared World Wide
Valfurva’s average annual precipitation is 1057 mm. Let’s compare this to some popular worldwide tourist destinations:
The city of Rome, Italy, has an average annual precipitation of 832 mm, spread fairly evenly throughout the year.
In Shanghai, China, the annual average precipitation is 1347 mm, with a humid subtropical climate.
Adelaide, Australia, enjoys 511 mm of annual precipitation, with dry summers and wet winters.
Ho Chi Minh City, Vietnam, receives 1955 mm of annual rainfall, with a pronounced wet season from May to November, typical of its tropical monsoon climate.
How is Precipitation Measured?
Precipitation amounts are measured using specific gauges installed at weather stations, collecting both rain and snow and any other type of precipitation. Rainfall is measured directly in millimeters, while that from snow and ice is obtained by melting it. Automated systems often incorporate heaters to make this easier.
Information from these stations is transmitted via Wi-Fi, satellite, GPS, or telephone connections to central monitoring networks. This information is immediately updated and integrated into weather models and forecasts.
Sea vs. Land Precipitation
The proximity of a location to a large body of water can significantly affect its rainfall patterns:
- Ocean Influence: Coastal regions typically receive more rainfall due to the presence of moisture-laden winds from the ocean. These regions tend to have more humid climates and experience more frequent precipitation, especially in winter.
- Continental Climates: Areas further from the sea, such as inland or continental regions, experience less frequent rainfall and more extreme seasonal variations in precipitation.
For more detailed information about Valfurva’s weather, including sunshine hours, humidity levels, and temperature data, visit our Valfurva Climate page.
Current rainfall in Valfurva


