Tinjacá Monthly Rainfall & Precipitation
This page shows both the average monthly rainfall and the number of rainy days in Tinjacá, Boyacá, Colombia. This average is based on long-term data collected between 1990 and 2020. Let's explore the details to provide you with a complete overview.
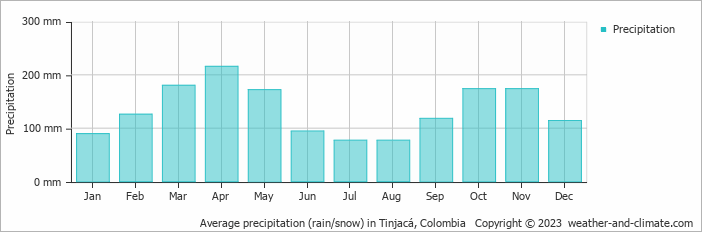
Tinjacá is known for its substantial rainfall, with annual precipitation reaching 1612 mm (63 in). While the overall climate is wet, there are notable seasonal patterns that create interesting contrasts, as demonstrated in our graph below.
Monthly Precipitation Levels
The average number of days each month with precipitation (> 0.2 mm (0.01 in))
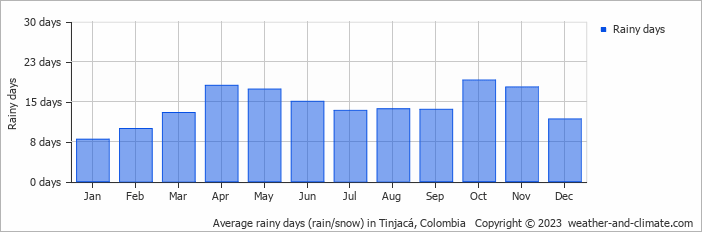
The seasons in Tinjacá, bring significant changes in precipitation. The wettest month, April, receives heavy rainfall, with an average of 216 mm (8.5 in) of precipitation. This rainfall is distributed across 18 rainy days.
In contrast, the driest month, July, experiences much less rainfall, totaling 77 mm (3 in) over 13 rainy days. These distinct seasonal differences provide diverse experiences throughout the year.April, the wettest month, has a maximum daytime temperature of 21°C (70°F). During the driest month July you can expect a temperature of 20°C (68°F). For more detailed insights into the city's temperatures, visit our Tinjacá Temperature page.
Annual Rainfall in Colombia: City Comparison
The map below shows the annual precipitation across Colombia. You can also select the different months in case you are interested in a specific month.
 heavy rainfall
 high
high
 moderate
 low
low
 almost none
Tinjacá vs World: Rainfall Compared
Tinjacá's average annual precipitation is 1612 mm (63 in). Let's compare this to some popular worldwide tourist destinations:
In Toronto, Canada, annual precipitation averages 964 mm (38 in), with snowy winters and rainy summers.
In Shanghai, China, the annual average precipitation is 1347 mm (53 in), with a humid subtropical climate.
In Tokyo, Japan, the average annual precipitation is 1528 mm (60 in), with significant summer rains due to typhoon season.
Bangkok, Thailand, experiences a tropical monsoon climate with 1668 mm (66 in) of annual rainfall, with the heaviest precipitation occurring during September and October.
Precipitation amounts are measured using specific gauges installed at weather stations, collecting both rain and snow and any other type of precipitation. Rainfall is measured directly in millimeters, while that from snow and ice is obtained by melting it. Automated systems often incorporate heaters to make this easier.
Information from these stations is transmitted via Wi-Fi, satellite, GPS, or telephone connections to central monitoring networks. This information is immediately updated and integrated into weather models and forecasts.
- The U.S. has a significant number of thunderstorms every year, with over 14.6 million taking place across the world annually.
- Approximately 70% of lightning bolts strike land rather than oceans.
- A storm named John was the longest-lasting Pacific tropical storm, continuing for 31 days. As it crossed the dateline twice, it changed status from a hurricane to a typhoon and back to a hurricane.
For more detailed information about Tinjacá's weather, including sunshine hours, humidity levels, and temperature data, visit our Tinjacá Climate page.


