Staggia Rainfall & Precipitation: Monthly Averages and Year-Round Insights
This page shows the average amount of rainfall per month in Staggia. The numbers are calculated over a 30-year period to provide a reliable average. Now, let’s break down all the details for a clearer picture.
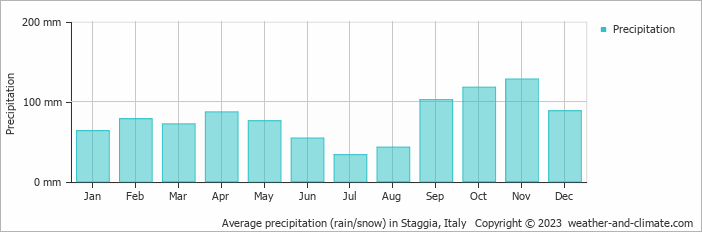
Generally, Staggia has a moderate amount of precipitation, averaging 942 mm of rain/snowfall annually.
Monthly Precipitation Levels
The average number of days each month with precipitation (> 0.2 mm)
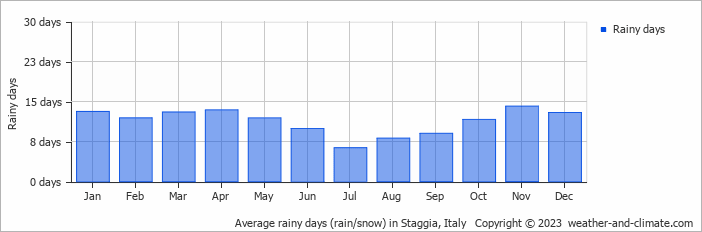
The climate in Staggia shows significant variation throughout the year. Expect 128 mm of precipitation during the wettest month November, distributed over 14 rainy days.
In contrast, July offers drier and sunnier days, with around 33 mm of rainfall over 6 rainy days.November, the wettest month, has a maximum daytime temperature of 15°C. The city receives 100 hours of sunshine in this period. During the driest month July you can expect a temperature of 30°C. For more detailed insights into the city’s temperatures, visit our Staggia Temperature page.
Annual Precipitation in Italy
The map below shows the annual precipitation across Italy. You can also select the different months in case you are interested in a specific month.


 heavy rainfall
 high
high
 moderate
 low
low
 almost none
Amsterdam Precipitation Compared World Wide
Staggia’s average annual precipitation is 942 mm. Let’s compare this to some popular worldwide tourist destinations:
Chicago, USA, sees an annual precipitation of 1062 mm, with rain and snow contributing to its humid climate.
In Shanghai, China, the annual average precipitation is 1347 mm, with a humid subtropical climate.
In Brisbane, Australia, the annual precipitation is 979 mm, making it wetter than Sydney.
Kuala Lumpur, Malaysia, receives 2529 mm of annual rainfall, characteristic of its equatorial tropical rainforest climate, with consistent rainfall throughout the year and peak months during March and November.
How is Precipitation Measured?
Precipitation amounts are measured using specific gauges installed at weather stations, collecting both rain and snow and any other type of precipitation. Rainfall is measured directly in millimeters, while that from snow and ice is obtained by melting it. Automated systems often incorporate heaters to make this easier.
Information from these stations is transmitted via Wi-Fi, satellite, GPS, or telephone connections to central monitoring networks. This information is immediately updated and integrated into weather models and forecasts.
Global Warming and Precipitation
Climate change is affecting precipitation patterns worldwide, including Staggia:
- Changing Rainfall Patterns: Global warming causes drastic changes in the patterns of rainfall. Some areas have been experiencing increased frequency and intensity of rainfall, while other areas experience longer dry spells or even droughts.
- Local Impacts: Many regions are experiencing heavier rainfall in the winter months and drier, hotter summers. This affects agriculture, water resources, and ecosystems.
For more detailed information about Staggia’s weather, including sunshine hours, humidity levels, and temperature data, visit our Staggia Climate page.
Current rainfall in Staggia


