San Isidro Monthly Rainfall & Precipitation
This page shows both the average monthly rainfall and the number of rainy days in San Isidro, Canary Islands, Spain. The numbers reflect climate data gathered over a 30-year period, from 1990 to 2020. Let's explore the details to provide you with a complete overview.
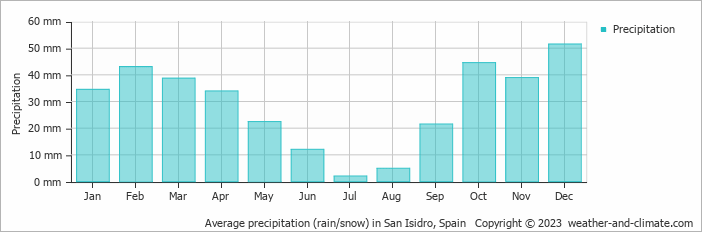
San Isidro typically sees modest rainfall throughout the year, with an average annual precipitation of 348 mm (14 in). The city experiences a distinct dry season during certain months, as illustrated in the graph below.
Monthly Rainfall & Rainy Days
Monthly Precipitation Levels
The average number of days each month with precipitation (> 0.2 mm (0.01 in))
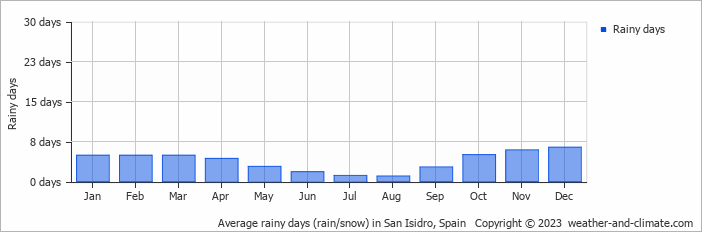
Significant seasonal changes in precipitation occur throughout the year. During the wettest month, December receives substantial rainfall, averaging 52 mm (2 in) of precipitation, recorded across 6 rainy days.
In contrast, the driest month, July brings less rainfall, with 2 mm (0.1 in) over a single rainy day.
December, the wettest month, has a maximum daytime temperature of 20°C (68°F). The city receives 171 hours of sunshine in this period. During the driest month July you can expect a temperature of 25°C (77°F). For more detailed insights into the city's temperatures, visit our San Isidro Temperature page.
Annual Rainfall in Spain: City Comparison
The map below shows the annual precipitation across Spain. You can also select the different months in case you are interested in a specific month.
San Isidro vs World: Rainfall Compared
San Isidro's average annual precipitation is 348 mm (14 in). Let's compare this to some popular worldwide tourist destinations:
In Lisbon, Portugal, the average annual precipitation is 774 mm (30 in), characterized by wet winters and dry summers typical of the Mediterranean climate.
In Seoul, South Korea, the average annual precipitation is 1237 mm (49 in), with most rain falling during the summer monsoon season.
Perth, Australia, receives 565 mm (22 in) of rainfall annually, mostly during the winter months.
Bangkok, Thailand, experiences a tropical monsoon climate with 1668 mm (66 in) of annual rainfall, with the heaviest precipitation occurring during September and October.
Precipitation amounts are measured using specific gauges installed at weather stations, collecting both rain and snow and any other type of precipitation. Rainfall is measured directly in millimeters, while that from snow and ice is obtained by melting it. Automated systems often incorporate heaters to make this easier.
Information from these stations is transmitted via Wi-Fi, satellite, GPS, or telephone connections to central monitoring networks. This information is immediately updated and integrated into weather models and forecasts.
Climate change is affecting precipitation patterns worldwide, including San Isidro:
- Changing Rainfall Patterns: Global warming causes drastic changes in the patterns of rainfall. Some areas have been experiencing increased frequency and intensity of rainfall, while other areas experience longer dry spells or even droughts.
- Local Impacts: Many regions are experiencing heavier rainfall in the winter months and drier, hotter summers. This affects agriculture, water resources, and ecosystems.
- "Ginger" was the longest-lasting Atlantic tropical storm, which spun around the open ocean for 28 days in 1971.
- The world's largest snowflake was recorded in the Guinness Book of Records, at 38 cm (15 inches) wide and 20 cm (7.9 inches) thick. The snowflake fell at Fort Keogh, Montana, USA, on 28 January 1887.
- The greatest snowfall recorded was on Mt. Rainier, Washington State, USA, over 31.5 meters (103 feet) fell during the winter of 1972.
For more detailed information about San Isidro's weather, including sunshine hours, humidity levels, and temperature data, visit our San Isidro Climate page.
San Isidro Weather by Month
Pick a month to see the average temperature, rainfall and sunshine in San Isidro - and find the best time to visit.


San Isidro 3-Day Forecast
Temperature Rainfall Sunshine Humidity
See the full San Isidro climate overview or explore weather in Spain.
Popular this month
Where to go in August - average daytime high across popular destinations.
 Seville
 36°C (97°F) Madrid34°C (93°F) Valencia31°C (88°F) Málaga29°C (84°F) Benidorm29°C (84°F) Calpe
 30°C (86°F) Marbella28°C (82°F) Barcelona28°C (82°F)














Bucket list
Need travel inspiration? Check out our bucket list articles and be inspired.
El Hierro: The smallest Canary island without mass tourism
Mainly nature lovers and those seeking tranquility go to El Hierro. The island is know for its beautiful mountains and you can wonder around for days here.
Spain in October: Where Is It Warmest and Sunniest?
Discover where Spain is warmest in October, with climate comparisons for Seville, Alicante, Málaga, Tenerife, Madrid and Barcelona.
Visit national Park El Teide
This national park is truly a unique place that you should not miss. You will find landscapes that seem to come from another plane and you will feel tiny in these impressive surroundings.
Sevilla: A Blend of Tradition, Culture, and Hidden Gems
Experience Sevilla in spring with Semana Santa processions and Feria de Abril festivities, set against the city's iconic landmarks and vibrant culture.