

















 Warm Sea Without Extreme Heat: 8 Beach Destinations With Comfortable Weather
Love warm seawater but not extreme heat? Compare eight beach destinations where the sea stays warm while daytime temperatures remain comfortable.
This page shows both the average monthly rainfall and the number of rainy days in Sal Rei, Boa Vista, Cape Verde. The numbers reflect climate data gathered over a 30-year period, from 1990 to 2020. Now, let's explore all the details to give you a full picture.
Sal Rei is known for its low rainfall, with yearly precipitation amounts around 113 mm (4.4 in).


The climate in Sal Rei shows significant variation throughout the year. Expect 43 mm (1.7 in) of precipitation during the wettest month September, distributed over 4 rainy days.
In contrast, May offers drier and sunnier days, with around 0.4 mm (0.02 in) of rainfall over a single rainy day.
September, the wettest month, has a maximum daytime temperature of 30°C (86°F). The city receives 179 hours of sunshine in this period. During the driest month May you can expect a temperature of 26°C (79°F). For more detailed insights into the city's temperatures, visit our Sal Rei Temperature page.
Browse day-by-day precipitation records for Sal Rei spanning 51 years. Select any month and year to see actual rainfall and snowfall recorded on each day.
The map below shows the annual precipitation across Cape Verde. You can also select the different months in case you are interested in a specific month.
Sal Rei's average annual precipitation is 113 mm (4.4 in). Let's compare this to some popular worldwide tourist destinations:
The climate in San Francisco, USA, is influenced by coastal weather, with 469 mm (18 in) of rainfall mostly during the winter months.
In Seoul, South Korea, the average annual precipitation is 1237 mm (49 in), with most rain falling during the summer monsoon season.
In Brisbane, Australia, the annual precipitation is 979 mm (39 in), making it wetter than Sydney.
Bangkok, Thailand, experiences a tropical monsoon climate with 1668 mm (66 in) of annual rainfall, with the heaviest precipitation occurring during September and October.
Precipitation amounts are measured using specific gauges installed at weather stations, collecting both rain and snow and any other type of precipitation. Rainfall is measured directly in millimeters, while that from snow and ice is obtained by melting it. Automated systems often incorporate heaters to make this easier.
Information from these stations is transmitted via Wi-Fi, satellite, GPS, or telephone connections to central monitoring networks. This information is immediately updated and integrated into weather models and forecasts.
For more detailed information about Sal Rei's weather, including sunshine hours, humidity levels, and temperature data, visit our Sal Rei Climate page.
Pick a month to see the average temperature, rainfall and sunshine in Sal Rei - and find the best time to visit.
Temperature Rainfall Sunshine Humidity
See the full Sal Rei climate overview or explore weather in Cape Verde.
Where to go in October - average daytime high across popular destinations.
Sal Rei 29°C (84°F) Praia29°C (84°F) Tarrafal28°C (82°F) Vila do Maio28°C (82°F) Santa Maria28°C (82°F) Porto Novo26°C (79°F) Ponta do Sol27°C (81°F) Mindelo27°C (81°F)
Need travel inspiration? Check out our bucket list articles and be inspired.
Warm Sea Without Extreme Heat: 8 Beach Destinations With Comfortable Weather
Love warm seawater but not extreme heat? Compare eight beach destinations where the sea stays warm while daytime temperatures remain comfortable.
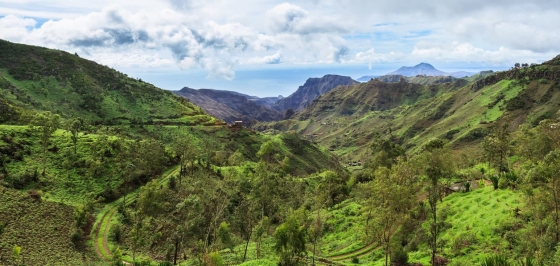 Cape Verde: Discover the largest island of Santiago
Uncover the hidden gem of Santiago—stunning beaches, cultural immersion, and an authentic African atmosphere await. Escape the crowds and explore this untouched paradise.

 Visit Kruger Park in South Africa
Are you going to South Africa, then you cannot skip the Kruger Park. The Kruger Park is one of the most beautiful and largest safari parks in the world.
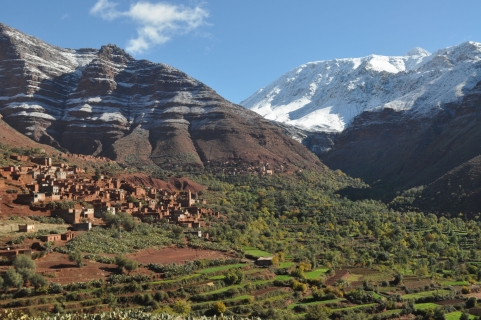
 The Atlas Mountains in Morocco
This mountain range is the second highest mountains in the world and is certainly one of the most natural and wonderful mountains you could ever visit. One for the bucket list for sure.