Rangsdorf Monthly Rainfall & Precipitation
This page shows both the average monthly rainfall and the number of rainy days in Rangsdorf, Brandenburg, Germany. The numbers reflect climate data gathered over a 30-year period, from 1990 to 2020. Now, let's explore all the details to give you a full picture.
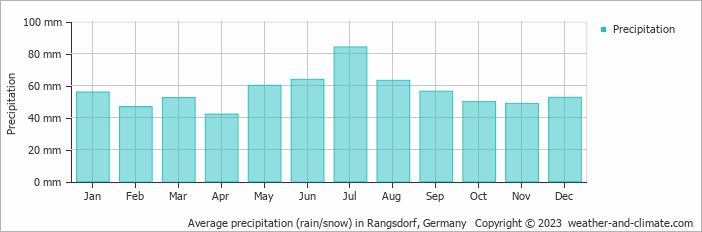
Generally, Rangsdorf experiences moderate precipitation patterns, averaging 675 mm (27 in) yearly.
Monthly Rainfall & Rainy Days
Monthly Precipitation Levels
The average number of days each month with precipitation (> 0.2 mm (0.01 in))
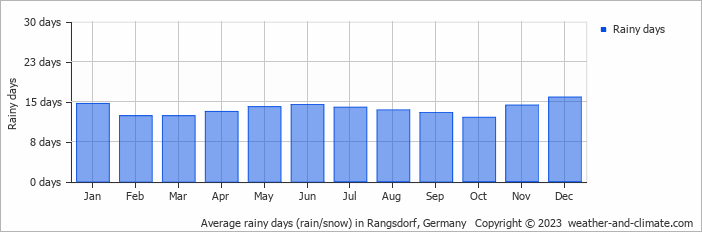
While rainfall varies throughout the year, each season offers its own charm. July brings wetter days averaging 84 mm (3.3 in) of precipitation, spread over 14 rainy days.
In contrast, April experiences a drier climate, with about 42 mm (1.7 in) of rainfall spread across 13 rainy days.
July, the wettest month, has a maximum daytime temperature of 26°C (79°F). The city receives 232 hours of sunshine in this period. During the driest month April you can expect a temperature of 16°C (61°F). For more detailed insights into the city's temperatures, visit our Rangsdorf Temperature page.
Annual Rainfall in Germany: City Comparison
The map below shows the annual precipitation across Germany. You can also select the different months in case you are interested in a specific month.
Rangsdorf vs World: Rainfall Compared
Rangsdorf's average annual precipitation is 675 mm (27 in). Let's compare this to some popular worldwide tourist destinations:
Boston, USA, experiences 1238 mm (49 in) of annual precipitation, including significant snowfall during the winter.
In Seoul, South Korea, the average annual precipitation is 1237 mm (49 in), with most rain falling during the summer monsoon season.
Adelaide, Australia, enjoys 511 mm (20 in) of annual precipitation, with dry summers and wet winters.
Singapore, situated near the equator, gets 2581 mm (102 in) of rainfall annually, with no distinct dry season and consistent monthly precipitation.
Precipitation amounts are measured using specific gauges installed at weather stations, collecting both rain and snow and any other type of precipitation. Rainfall is measured directly in millimeters, while that from snow and ice is obtained by melting it. Automated systems often incorporate heaters to make this easier.
Information from these stations is transmitted via Wi-Fi, satellite, GPS, or telephone connections to central monitoring networks. This information is immediately updated and integrated into weather models and forecasts.
- "Ginger" was the longest-lasting Atlantic tropical storm, which spun around the open ocean for 28 days in 1971.
- The world's largest snowflake was recorded in the Guinness Book of Records, at 38 cm (15 inches) wide and 20 cm (7.9 inches) thick. The snowflake fell at Fort Keogh, Montana, USA, on 28 January 1887.
- The greatest snowfall recorded was on Mt. Rainier, Washington State, USA, over 31.5 meters (103 feet) fell during the winter of 1972.
For more detailed information about Rangsdorf's weather, including sunshine hours, humidity levels, and temperature data, visit our Rangsdorf Climate page.
Rangsdorf Weather by Month
Pick a month to see the average temperature, rainfall and sunshine in Rangsdorf - and find the best time to visit.
Rangsdorf 3-Day Forecast
Temperature Rainfall Sunshine Humidity Wind Speed
See the full Rangsdorf climate overview or explore weather in Germany.
Popular this month
Where to go in July - average daytime high across popular destinations.
Bucket list
Need travel inspiration? Check out our bucket list articles and be inspired.
 The 10 most beautiful towns in Germany
Explore Germany's hidden gems with our guide to 10 stunning cities beyond Berlin. Discover historic towns, unique culture, and cozy atmospheres."
The dreamlike scenery of the German Alps
Nature in the most south-eastern part of Germany is impressive. The German Alps, with their diversity of landscapes, are an ideal destination for a wonderful holiday in nature.
Discover Germany's Black Forest
Immerse yourself in nature and enjoy sustainable tourism practices in Germany's Black Forest. Hike, do yoga, and savor local organic cuisine and beer.
 Cycle the Danube trail
The Danube cycle route is one of the most popular cycling routes in Europe, and rightly so, because it is a varied route that is interesting both in terms of culture and nature.