
















 Go to Bovec in Slovenia
With mountains that linger in the blue sky, an emerald-green river Bovec offers picturesque scenes that are a must see for your bucket list.
This page shows both the average monthly rainfall and the number of rainy days in Piran, Slovenian Littoral (Primorska), Slovenia. These averages rely on historical data collected over 30 years, from 1990 to 2020. Let's explore the details to provide you with a complete overview.
Piran has a notably wet climate with abundant precipitation, recording 1280 mm (50 in) of rainfall per year.
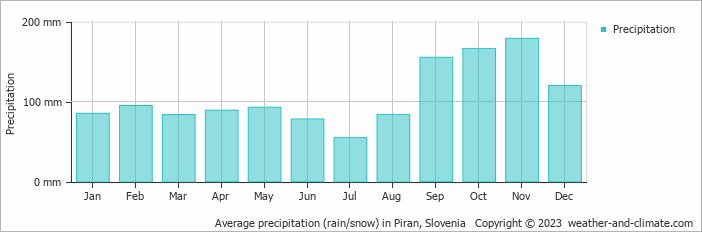
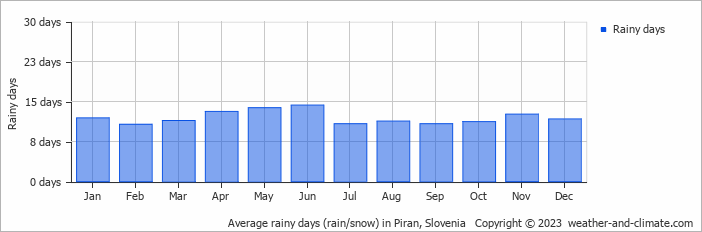
The seasons in Piran, bring significant changes in precipitation. The wettest month, November, receives heavy rainfall, with an average of 179 mm (7 in) of precipitation. This rainfall is distributed across 13 rainy days.
In contrast, the driest month, July, experiences much less rainfall, totaling 55 mm (2.2 in) over 11 rainy days. These distinct seasonal differences provide diverse experiences throughout the year.November, the wettest month, has a maximum daytime temperature of 15°C (59°F). The city receives 110 hours of sunshine in this period. During the driest month July you can expect a temperature of 27°C (81°F). For more detailed insights into the city's temperatures, visit our Piran Temperature page.
Average daily rainfall for each day of the month based on long-term records. 50-year average (1976-2025)
Browse day-by-day precipitation records for Piran spanning 51 years. Select any month and year to see actual rainfall and snowfall recorded on each day.
The map below shows the annual precipitation across Slovenia. You can also select the different months in case you are interested in a specific month.
Piran's average annual precipitation is 1280 mm (50 in). Let's compare this to some popular worldwide tourist destinations:
Seville, Spain, experiences 541 mm (21 in) of rainfall annually, with wet winters and dry summers typical of southern Spain.
Osaka, Japan, experiences 1507 mm (59 in) of rainfall annually, spread across the year with wetter summers.
Adelaide, Australia, enjoys 511 mm (20 in) of annual precipitation, with dry summers and wet winters.
Bangkok, Thailand, experiences a tropical monsoon climate with 1668 mm (66 in) of annual rainfall, with the heaviest precipitation occurring during September and October.
Precipitation amounts are measured using specific gauges installed at weather stations, collecting both rain and snow and any other type of precipitation. Rainfall is measured directly in millimeters, while that from snow and ice is obtained by melting it. Automated systems often incorporate heaters to make this easier.
Information from these stations is transmitted via Wi-Fi, satellite, GPS, or telephone connections to central monitoring networks. This information is immediately updated and integrated into weather models and forecasts.
For more detailed information about Piran's weather, including sunshine hours, humidity levels, and temperature data, visit our Piran Climate page.
Pick a month to see the average temperature, rainfall and sunshine in Piran - and find the best time to visit.
Temperature Rainfall Sunshine Humidity
See the full Piran climate overview or explore weather in Slovenia.
Where to go in October - average daytime high across popular destinations.
Piran 19°C (66°F) Portorož19°C (66°F) Maribor
 16°C (61°F) Ljubljana16°C (61°F) Bovec14°C (57°F) Bled14°C (57°F) Bohinj14°C (57°F) Kranjska Gora13°C (55°F)
 Need travel inspiration? Check out our bucket list articles and be inspired.
Go to Bovec in Slovenia
With mountains that linger in the blue sky, an emerald-green river Bovec offers picturesque scenes that are a must see for your bucket list.
 Experience Dazzling Fairy Tales In The Lake Bled Of Slovenia
Slovenia's most well-known tourist destination is Lake Bled, which is still relatively undiscovered when compared to other European attractions despite its growing notoriety.

 The 10 most charming villages in France
Discover France's top 10 beautiful villages. From Normandy to the Côte d'Azur, experience quaint squares and cobbled streets. Which one will you visit this summer?

 The train journey from Bucharest to Brasov is one of the most beautiful in Romania
In three hours, you'll get from Bucharest to Brasov by train. It is one of the most beautiful routes in Romania, certainly the most beautiful that can be done by express train.